

Question: ****** Please Use MATLAB ******* For this specific experiment, a 2D wing, known as an airfoil, is tested inside one of WVU's wind tunnels. Pressure
****** Please Use MATLAB *******
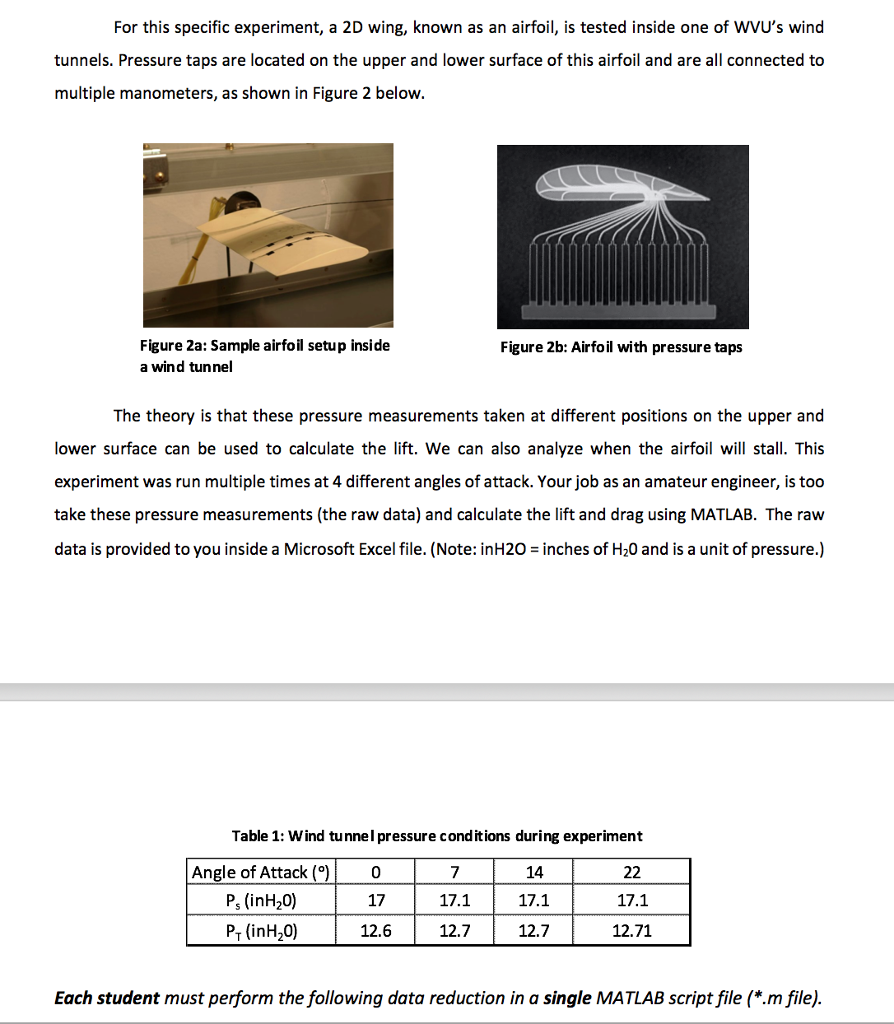
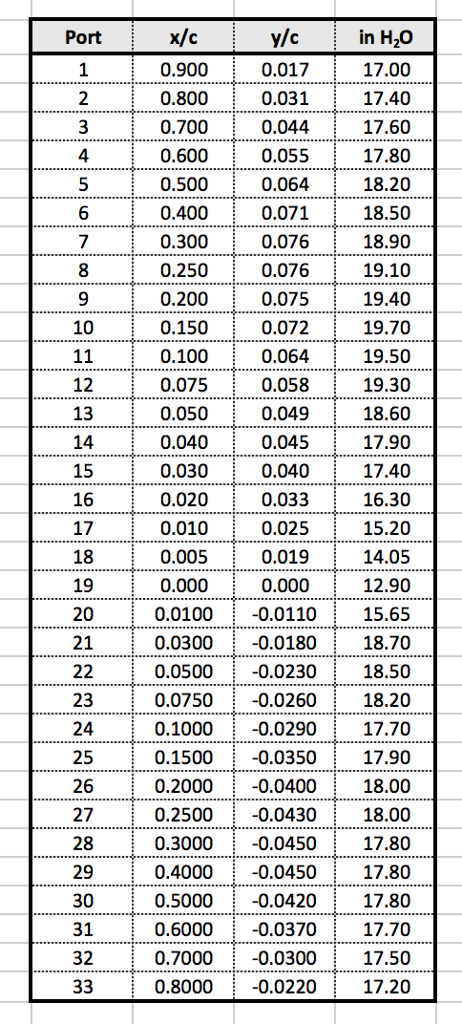
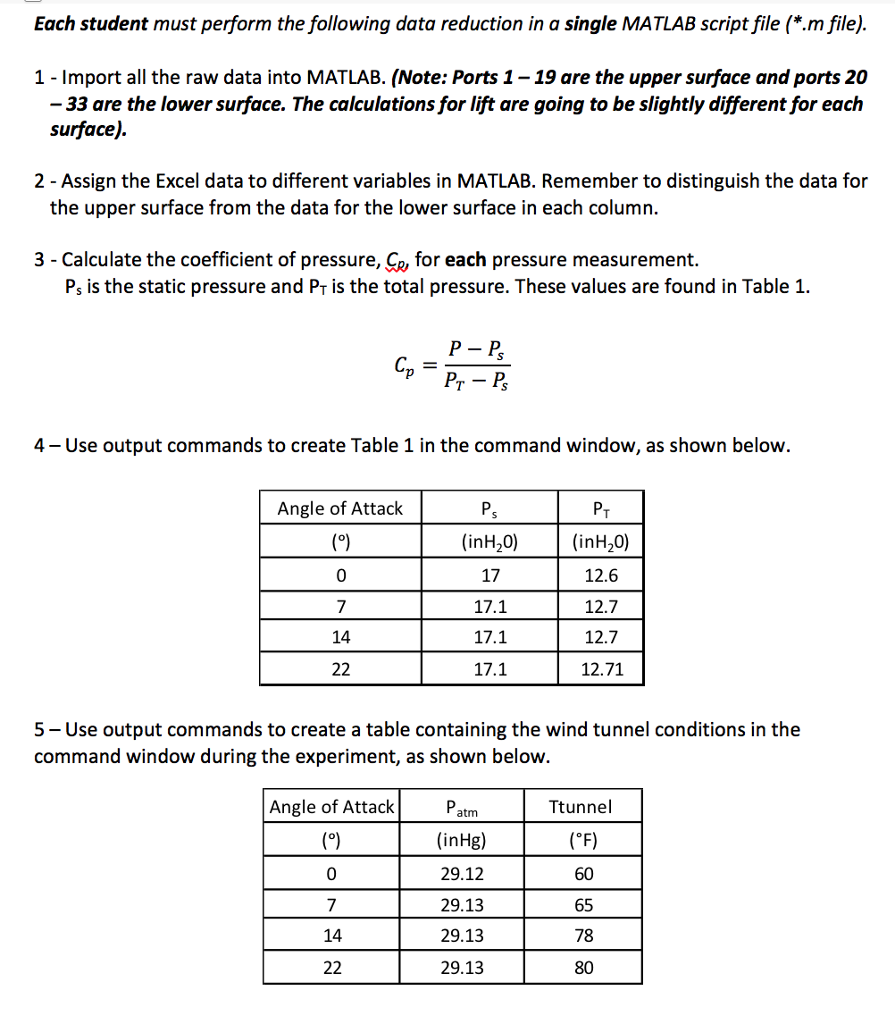
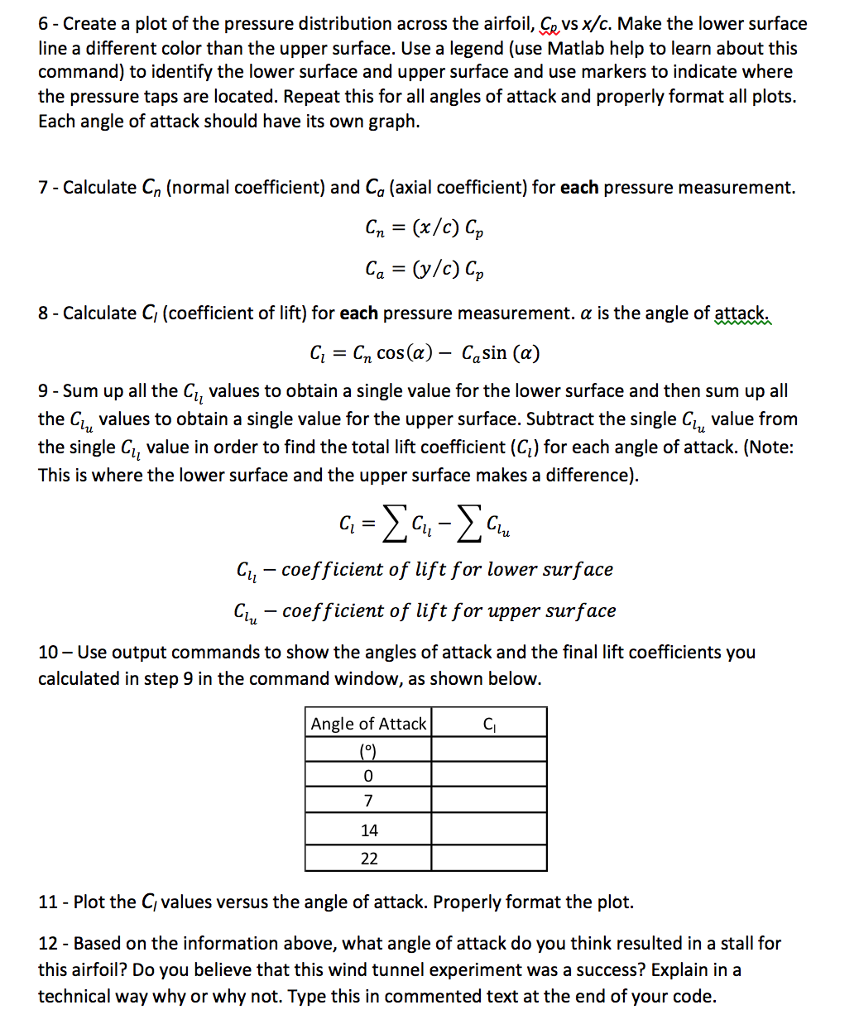
For this specific experiment, a 2D wing, known as an airfoil, is tested inside one of WVU's wind tunnels. Pressure taps are located on the upper and lower surface of this airfoil and are all connected to multiple manometers, as shown in Figure 2 belovw Figure 2a: Sample airfoil setup inside a wind tunnel Figure 2b: Airfoil with pressure taps The theory is that these pressure measurements taken at different positions on the upper and lower surface can be used to calculate the lift. We can also analyze when the airfoil will stall. This experiment was run multiple times at 4 different angles of attack. Your job as an amateur engineer, is too take these pressure measurements (the raw data) and calculate the lift and drag using MATLAB. The raw data is provided to you inside a Microsoft Excel file. (Note: inH20 inches of H20 and is a unit of pressure.) Table 1: W ind tunnel pressure conditions during experiment Angle of Attack () Ps (inH20) Pr (inH20) 0 17 12.6 17.1 12.7 14 17.1 12.7 17.1 12.71 Each student must perform the following data reduction in a single MATLAB script file (*.m file) For this specific experiment, a 2D wing, known as an airfoil, is tested inside one of WVU's wind tunnels. Pressure taps are located on the upper and lower surface of this airfoil and are all connected to multiple manometers, as shown in Figure 2 belovw Figure 2a: Sample airfoil setup inside a wind tunnel Figure 2b: Airfoil with pressure taps The theory is that these pressure measurements taken at different positions on the upper and lower surface can be used to calculate the lift. We can also analyze when the airfoil will stall. This experiment was run multiple times at 4 different angles of attack. Your job as an amateur engineer, is too take these pressure measurements (the raw data) and calculate the lift and drag using MATLAB. The raw data is provided to you inside a Microsoft Excel file. (Note: inH20 inches of H20 and is a unit of pressure.) Table 1: W ind tunnel pressure conditions during experiment Angle of Attack () Ps (inH20) Pr (inH20) 0 17 12.6 17.1 12.7 14 17.1 12.7 17.1 12.71 Each student must perform the following data reduction in a single MATLAB script file (*.m file)
Step by Step Solution
There are 3 Steps involved in it

Get step-by-step solutions from verified subject matter experts