

Question: please use matlab LB 9Chpt below that will generate a SINGLE figure co of sin(x), cos(x), and tan(x) from -pi to pi, in 1 row
please use matlab
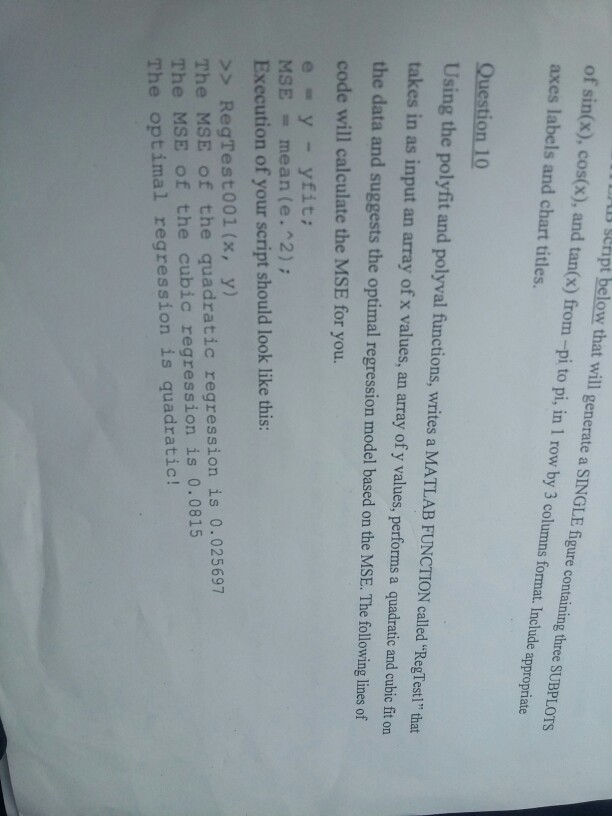
LB 9Chpt below that will generate a SINGLE figure co of sin(x), cos(x), and tan(x) from -pi to pi, in 1 row by 3 columns format. Include appropriate axes labels and chart titles. ntaining three SUBPLOTs Question 10 Using the polyfit and polyval functions, writes a MATLAB FUNCTION called "RegTest!" that takes in as input an array of x values, an array of y values, performs a quadratic and cubic fit on the data and suggests the optimal regression model based on the MSE. The following lines of code will calculate the MSE for you. e = y - yfit; MSE = mean (e. ^2) ; Execution of your script should look like this: >>RegTest001 (x, y) The MSE of the quadratic regression is 0.025697 The MSE of the cubic regression is 0.0815 The optimal regression is quadratic
Step by Step Solution
There are 3 Steps involved in it

Get step-by-step solutions from verified subject matter experts