

Question: please use MATLAB to answer 5: Visualizing Waves Write a program to visualize a plane wave using a pcolor or surface plot. Specifications: Set the
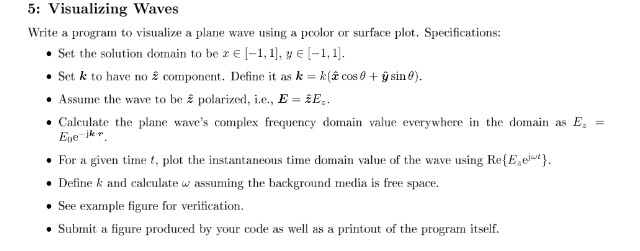
5: Visualizing Waves Write a program to visualize a plane wave using a pcolor or surface plot. Specifications: Set the solution domain to be rel-1, 1), y (-1,1]. Set k to have no component. Define it as k=ki cos 0 + y sin 8). Assume the wave to be polarized, i.e., E = E. Calculate the plane wave's complex frequency domain value everywhere in the domain as E Evej = W }. For a given time t, plot the instantaneous time domain value of the wave using Re{ E Define k and calculate w assuming the background media is free space. See example figure for verification. Submit a figure produced by your code as well as a printout of the program itself. 5: Visualizing Waves Write a program to visualize a plane wave using a pcolor or surface plot. Specifications: Set the solution domain to be rel-1, 1), y (-1,1]. Set k to have no component. Define it as k=ki cos 0 + y sin 8). Assume the wave to be polarized, i.e., E = E. Calculate the plane wave's complex frequency domain value everywhere in the domain as E Evej = W }. For a given time t, plot the instantaneous time domain value of the wave using Re{ E Define k and calculate w assuming the background media is free space. See example figure for verification. Submit a figure produced by your code as well as a printout of the program itself
Step by Step Solution
There are 3 Steps involved in it

Get step-by-step solutions from verified subject matter experts