

Question: Please use MATLAB to complete and explain and show code written. Thanks! Use the import data tool to import the data set representing weight-in-motion data
Please use MATLAB to complete and explain and show code written. Thanks!
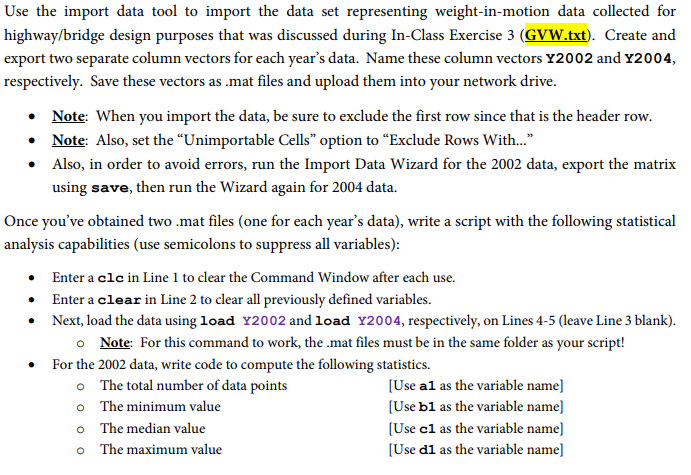
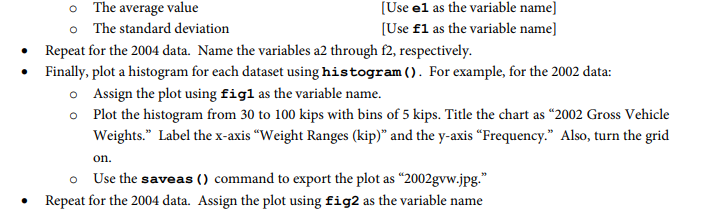
Use the import data tool to import the data set representing weight-in-motion data collected for highway/bridge design purposes that was discussed during In-Class Exercise 3 (GVW.txt). Create and export two separate column vectors for each year's data. Name these column vectors Y2002 and Y2004, respectively. Save these vectors as mat files and upload them into your network drive. Note: When you import the data, be sure to exclude the first row since that is the header row. Note: Also, set the "Unimportable Cells" option to "Exclude Rows With... Also, in order to avoid errors, run the Import Data Wizard for the 2002 data, export the matrix using save, then run the Wizard again for 2004 data. Once you've obtained two .mat files (one for each year's data), write a script with the following statistical analysis capabilities (use semicolons to suppress all variables): Enter a clc in Line 1 to clear the Command Window after each use. Enter a clear in Line 2 to clear all previously defined variables. Next, load the data using load Y2002 and load Y2004, respectively, on Lines 4-5 (leave Line 3 blank). o Note For this command to work, the .mat files must be in the same folder as your script! For the 2002 data, write code to compute the following statistics. o The total number of data points o The minimum value o The median value o The maximum value [Use al as the variable name] [Use bl as the variable name] [Use cl as the variable name] Use dl as the variable name] Use the import data tool to import the data set representing weight-in-motion data collected for highway/bridge design purposes that was discussed during In-Class Exercise 3 (GVW.txt). Create and export two separate column vectors for each year's data. Name these column vectors Y2002 and Y2004, respectively. Save these vectors as mat files and upload them into your network drive. Note: When you import the data, be sure to exclude the first row since that is the header row. Note: Also, set the "Unimportable Cells" option to "Exclude Rows With... Also, in order to avoid errors, run the Import Data Wizard for the 2002 data, export the matrix using save, then run the Wizard again for 2004 data. Once you've obtained two .mat files (one for each year's data), write a script with the following statistical analysis capabilities (use semicolons to suppress all variables): Enter a clc in Line 1 to clear the Command Window after each use. Enter a clear in Line 2 to clear all previously defined variables. Next, load the data using load Y2002 and load Y2004, respectively, on Lines 4-5 (leave Line 3 blank). o Note For this command to work, the .mat files must be in the same folder as your script! For the 2002 data, write code to compute the following statistics. o The total number of data points o The minimum value o The median value o The maximum value [Use al as the variable name] [Use bl as the variable name] [Use cl as the variable name] Use dl as the variable name]
Step by Step Solution
There are 3 Steps involved in it

Get step-by-step solutions from verified subject matter experts