

Question: Please use matlab to create a heatmap using the heatmap function. Introduction You will apply your complex looping skills to an engineering context. Problem Image
Please use matlab to create a heatmap using the heatmap function.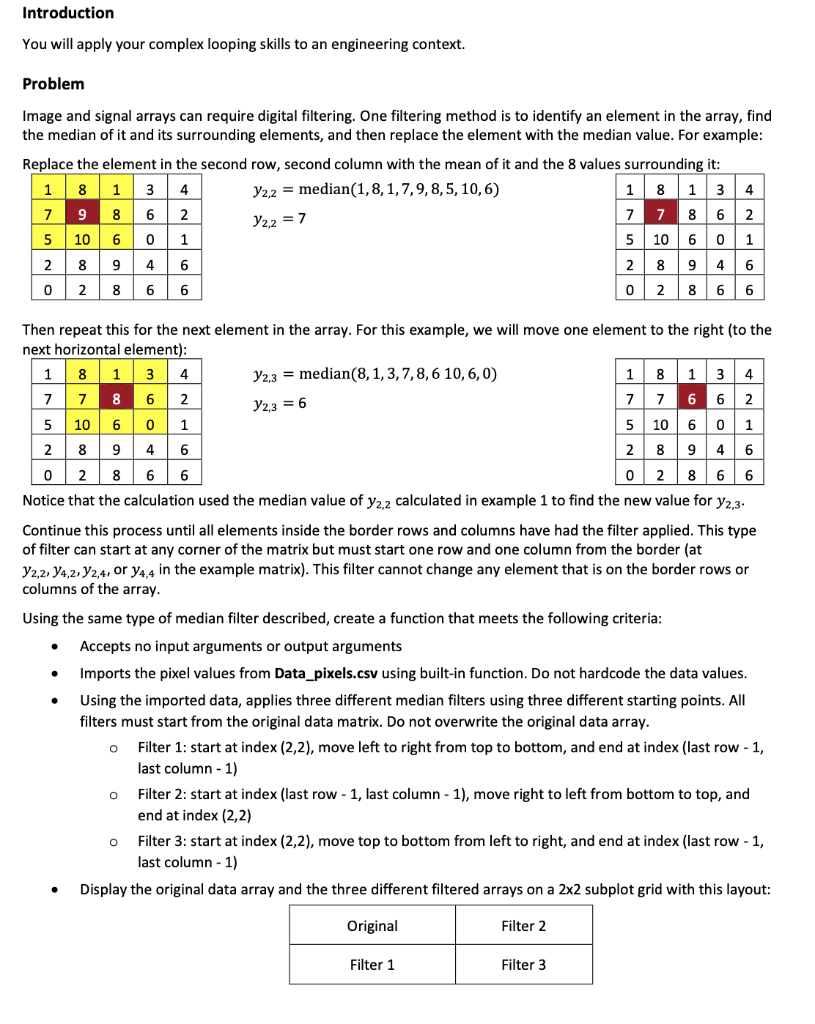
Introduction You will apply your complex looping skills to an engineering context. Problem Image and signal arrays can require digital filtering. One filtering method is to identify an element in the array, find the median of it and its surrounding elements, and then replace the element with the median value. For example: Replace the element in the second row, second column with the mean of it and the 8 values surrounding it: 1 8 1 3 4 Y2,2 = median(1,8, 1,7,9,8,5, 10,6) 1 8 13 4 7 9 8 6 2 7 7 8 6 2 5 10 6 0 1 5 10 6 0 1 2 8 9 4 6 2 8 9 4 6 0 2 8 6 6 0 2 8 6 6 122 = 7 Then repeat this for the next element in the array. For this example, we will move one element to the right (to the next horizontal element): 1 8 1 3 4 72,3 = median(8,1,3,7,8,6 10,6,0) | 1 8 1 3 4 7 7 8 6 2 Y2,3 = 6 7 7 6 6 2 5 10 6 0 1 5 10 6 0 1 2 8 9 4 6 2 89 46 0 2 8 6 6 0 2 8 6 6 Notice that the calculation used the median value of y2,2 calculated in example 1 to find the new value for y2,3- Continue this process until all elements inside the border rows and columns have had the filter applied. This type of filter can start at any corner of the matrix but must start one row and one column from the border (at 72,2, 94,2, 72,4, or 74,4 in the example matrix). This filter cannot change any element that is on the border rows or columns of the array. o Using the same type of median filter described, create a function that meets the following criteria: Accepts no input arguments or output arguments Imports the pixel values from Data_pixels.csv using built-in function. Do not hardcode the data values. Using the imported data, applies three different median filters using three different starting points. All filters must start from the original data matrix. Do not overwrite the original data array. Filter 1: start at index (2,2), move left to right from top to bottom, and end at index (last row - 1, last column - 1) Filter 2: start at index (last row - 1, last column - 1), move right to left from bottom to top, and end at index (2,2) Filter 3: start at index (2,2), move top to bottom from left to right, and end at index (last row - 1, last column - 1) Display the original data array and the three different filtered arrays on a 2x2 subplot grid with this layout: O o . Original Filter 2 Filter 1 Filter 3
Step by Step Solution
There are 3 Steps involved in it

Get step-by-step solutions from verified subject matter experts