

Question: Please use matlab to explain. third screenshot is the figure (1) for quesiton 1b Background You have been asked to manage a project to install
Please use matlab to explain. third screenshot is the figure (1) for quesiton 1b
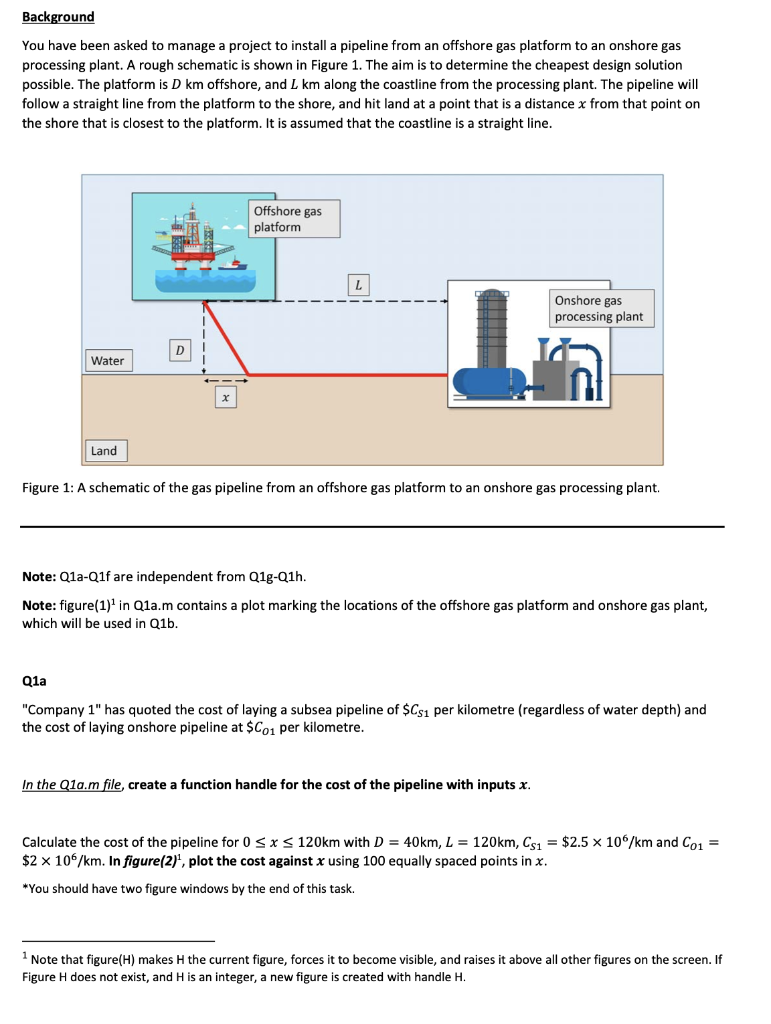
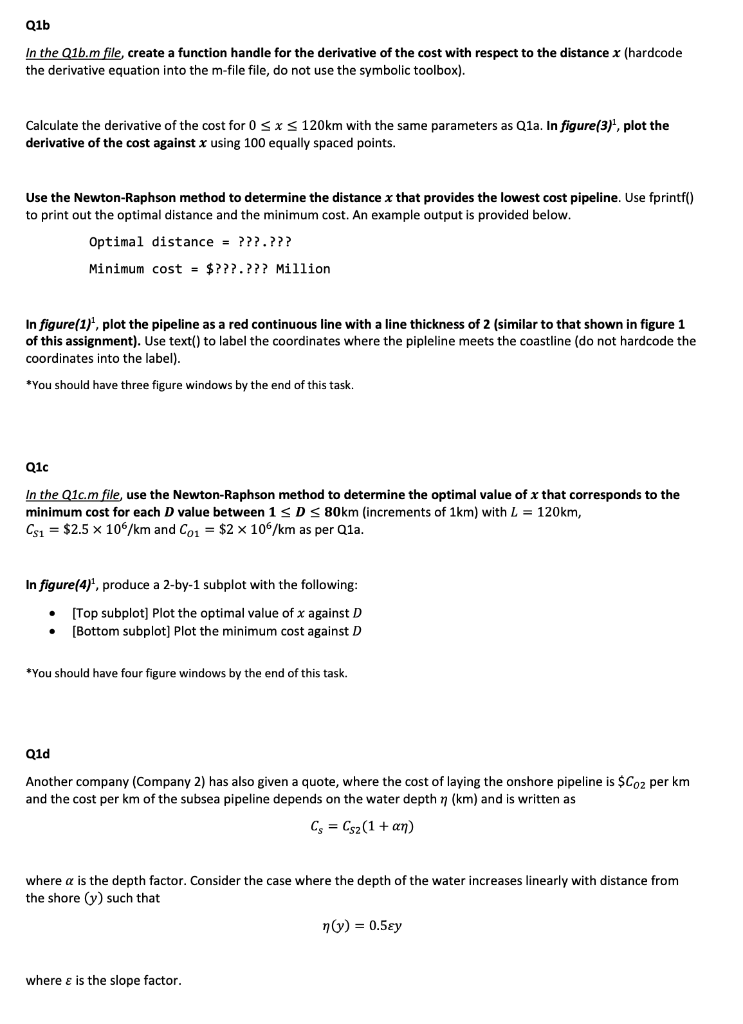
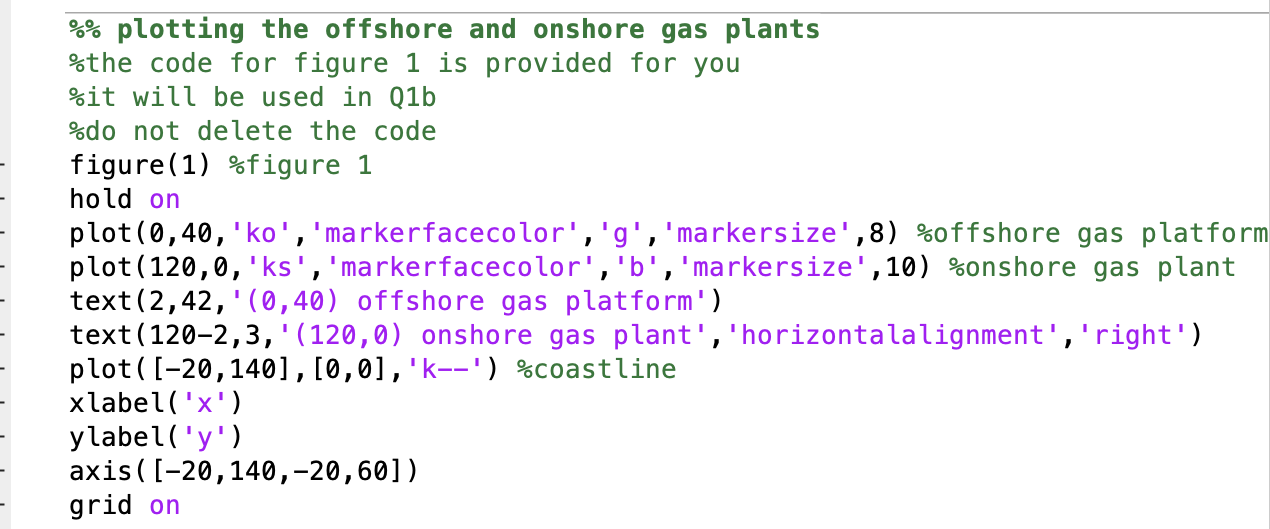
Background You have been asked to manage a project to install a pipeline from an offshore gas platform to an onshore gas processing plant. A rough schematic is shown in Figure 1. The aim is to determine the cheapest design solution possible. The platform is D km offshore, and L km along the coastline from the processing plant. The pipeline will follow a straight line from the platform to the shore, and hit land at a point that is a distance x from that point on the shore that is closest to the platform. It is assumed that the coastline is a straight line. Offshore gas platform L Onshore gas processing plant D Water Land Figure 1: A schematic of the gas pipeline from an offshore gas platform to an onshore gas processing plant. Note: Q1a-Q1f are independent from Q1g-Q1h. Note: figure(1) in Q1a.m contains a plot marking the locations of the offshore gas platform and onshore gas plant, which will be used in Q1b. Q1a "Company 1" has quoted the cost of laying a subsea pipeline of $C31 per kilometre (regardless of water depth) and the cost of laying onshore pipeline at $Coi per kilometre. In the Q1a.m file, create a function handle for the cost of the pipeline with inputs x. Calculate the cost of the pipeline for 0 SX S120km with D = 40km, L = 120km, Cs1 = $2.5 x 10/km and Co1 = $2 x 10⁶/km. In figure(2), plot the cost against x using 100 equally spaced points in x. *You should have two figure windows by the end of this task. Note that figure(H) makes the current figure, forces it to become visible, and raises it above all other figures on the screen. If Figure H does not exist, and H is an integer, a new figure is created with handle H. Q1b In the Q1b.m file, create a function handle for the derivative of the cost with respect to the distance x (hardcode the derivative equation into the m-file file, do not use the symbolic toolbox). Calculate the derivative of the cost for 0 SX S120km with the same parameters as Q1a. In figure(3), plot the derivative of the cost against x using 100 equally spaced points. Use the Newton-Raphson method to determine the distance x that provides the lowest cost pipeline. Use fprintf() to print out the optimal distance and the minimum cost. An example output is provided below. Optimal distance = ???.??? Minimum cost = $???.??? Million In figure(1)', plot the pipeline as a red continuous line with a line thickness of 2 (similar to that shown in figure 1 of this assignment). Use text() to label the coordinates where the pipleline meets the coastline (do not hardcode the coordinates into the label). *You should have three figure windows by the end of this task. Q1c In the Q1c.m file, use the Newton-Raphson method to determine the optimal value of x that corresponds to the minimum cost for each D value between 1 SD
Step by Step Solution
There are 3 Steps involved in it

Get step-by-step solutions from verified subject matter experts