

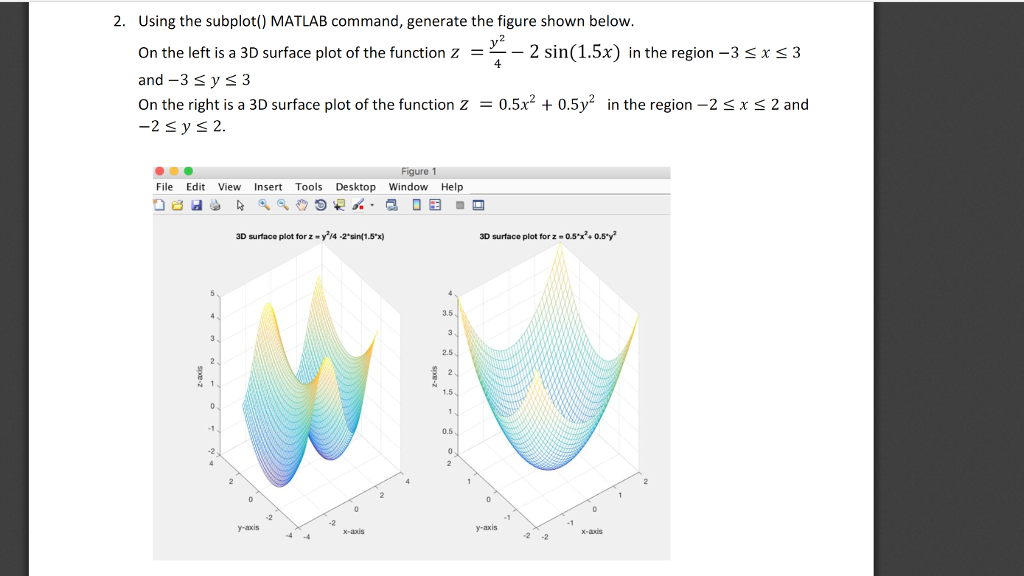
Question: please use matlab to solve 2. Using the subplot() MATLAB command, generate the figure shown below. On the left is a 3D surface plot of
please use matlab to solve
2. Using the subplot() MATLAB command, generate the figure shown below. On the left is a 3D surface plot of the function z 2 sin(1.5x) in the region -3
Step by Step Solution
There are 3 Steps involved in it
1 Expert Approved Answer
Step: 1 Unlock

Question Has Been Solved by an Expert!
Get step-by-step solutions from verified subject matter experts
Step: 2 Unlock
Step: 3 Unlock