

Question: Please use microsoft excel, and post the table along with a scatter plot and trend line. Thank you! Question The following table shows the average

Please use microsoft excel, and post the table along with a scatter plot and trend line. Thank you!
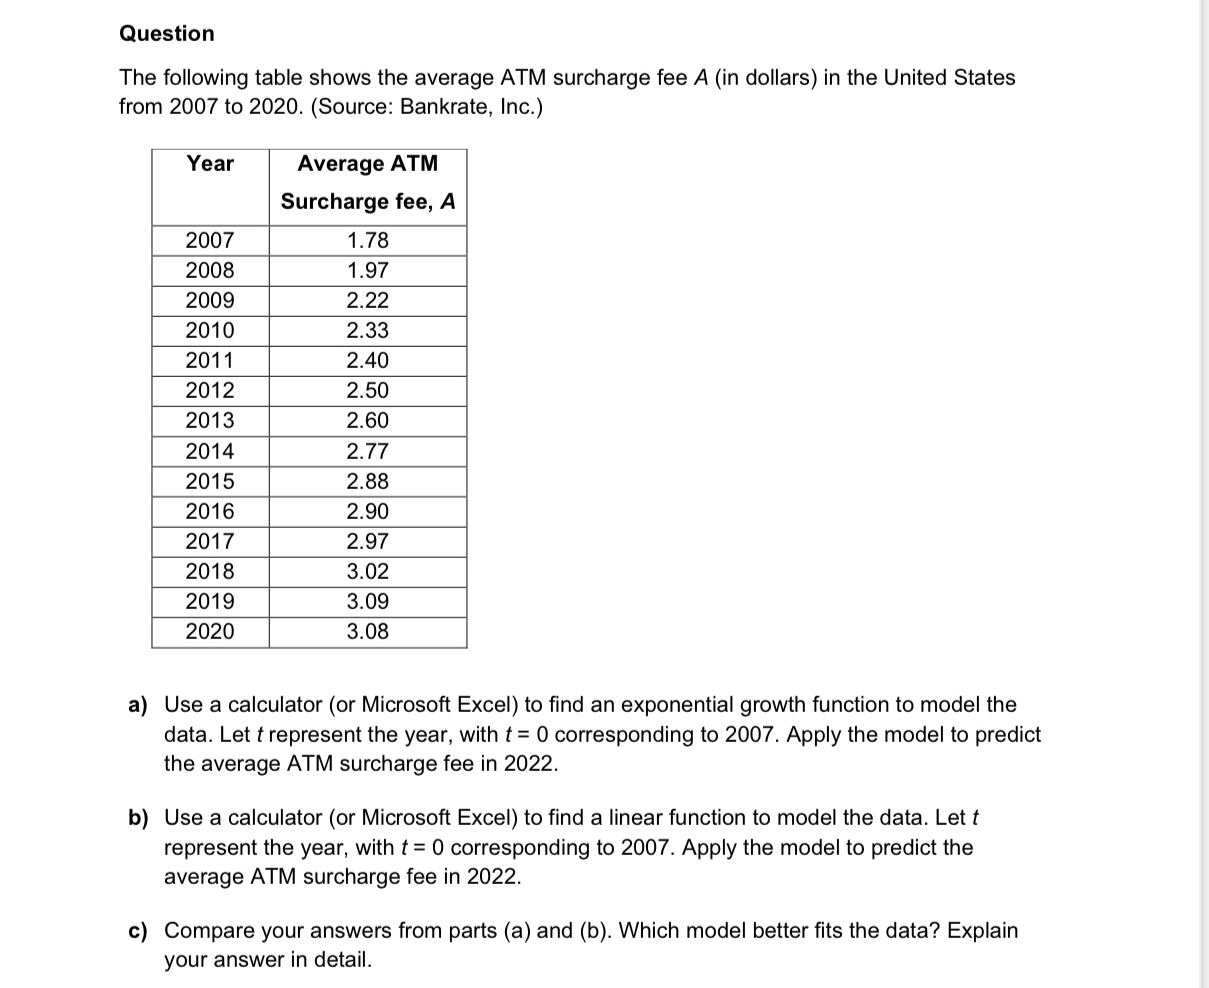
Question The following table shows the average ATM surcharge fee A (in dollars) in the United States from 2007 to 2020. (Source: Bankrate, Inc.) Year Average ATM Surcharge fee, A 1.78 a) Use a calculator (or Microsoft Excel) to nd an exponential growth function to model the data. Let I represent the year, with f= 0 corresponding to 2007. Apply the model to predict the average ATM surcharge fee in 2022. b) Use a calculator (or Microsoft Excel) to find a linear function to model the data. Let r represent the year, with t= 0 corresponding to 2007. Apply the model to predict the average ATM surcharge fee in 2022. c) Compare your answers from parts (a) and (b). Which model better fits the data? Explain your answer in detail
Step by Step Solution
There are 3 Steps involved in it

Get step-by-step solutions from verified subject matter experts