

Question: please use microsoft project for GANTT chart please use microsoft visio for PERT chart please follow steps 1-5 in the bottom thank you! Microsoft Project
please use microsoft project for GANTT chart
Microsoft Project Exercise 1. Follow the video demonstration in Week 11 to create a Gantt chart in Microsoft Project (or similar software such as Lucid Chart, https://www.lucidchart.com/blog/how-to-use-a-gantt-chart, if you are using a Mac). 2. Pay attention to the detail: For each task you will need to assign the resources (it could be manpower, machine/equipment, or facility). If there is a red figure at the beginning of the task, that means that you have an overallocation of the specific resources. Do fix that before you submit your file. 3. Check if your critical path is the same as what you identified in assignment A6. If not, you have mistakes in your Gantt chart. Please do fix that before turning it in. 4. Print your Gantt chart, https://docs.microsoft.com/en-us/office/troubleshoot/project/print-gantt-chart- view-without-table, and save it as a PDF file. Do NOT submit your Microsoft Project file. LF Slack Microsoft Visio Exercise The table below shows the name, duration, and the predecessor(s) of specific tasks. Activity Predecessor Duration ES EF LS A 3 B A 4 2 D B 5 E 1 F 2 G D, E 4 H F,G 3 1. Develop a PERT chart based on the information provided 2. Determine the critical path and calculate ES, EF, LS, LF and slack of each task: 3. Once you finish your PERT chart, please use the PERT1 template in Microsoft Visio to create your PERT chart. 4. Change the color of tasks and arrows to highlight the critical path. 5. Submit your Visio drawing as a PDF file (not a Visio file) to ReggieNet. Microsoft Project Exercise 1. Follow the video demonstration in Week 11 to create a Gantt chart in Microsoft Project (or similar software such as Lucid Chart, https://www.lucidchart.com/blog/how-to-use-a-gantt-chart, if you are using a Mac). 2. Pay attention to the detail: For each task you will need to assign the resources (it could be manpower, machine/equipment, or facility). If there is a red figure at the beginning of the task, that means that you have an overallocation of the specific resources. Do fix that before you submit your file. 3. Check if your critical path is the same as what you identified in assignment A6. If not, you have mistakes in your Gantt chart. Please do fix that before turning it in. 4. Print your Gantt chart, https://docs.microsoft.com/en-us/office/troubleshoot/project/print-gantt-chart- view-without-table, and save it as a PDF file. Do NOT submit your Microsoft Project file. LF Slack Microsoft Visio Exercise The table below shows the name, duration, and the predecessor(s) of specific tasks. Activity Predecessor Duration ES EF LS A 3 B A 4 2 D B 5 E 1 F 2 G D, E 4 H F,G 3 1. Develop a PERT chart based on the information provided 2. Determine the critical path and calculate ES, EF, LS, LF and slack of each task: 3. Once you finish your PERT chart, please use the PERT1 template in Microsoft Visio to create your PERT chart. 4. Change the color of tasks and arrows to highlight the critical path. 5. Submit your Visio drawing as a PDF file (not a Visio file) to ReggieNet please use microsoft visio for PERT chart
please follow steps 1-5 in the bottom thank you! 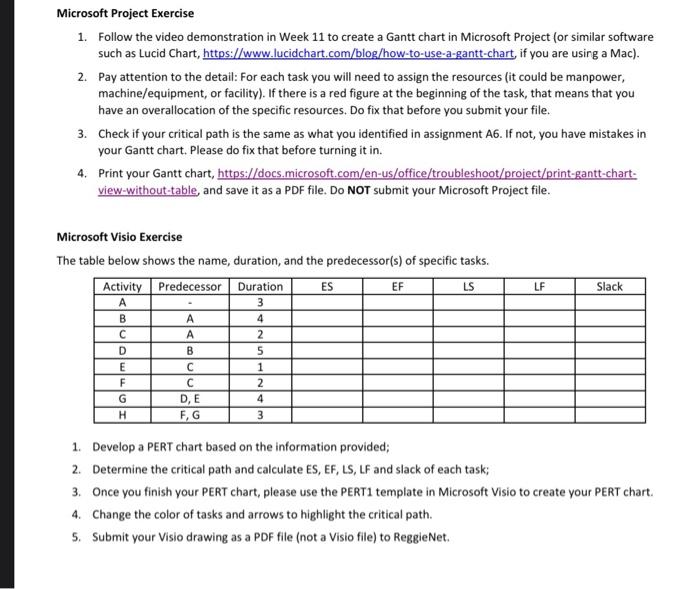
Step by Step Solution
There are 3 Steps involved in it
1 Expert Approved Answer
Step: 1 Unlock

Question Has Been Solved by an Expert!
Get step-by-step solutions from verified subject matter experts
Step: 2 Unlock
Step: 3 Unlock