Question: PLEASE USE MINITAB TO SOLVE AND EXPLAIN ALL STEPS PLEASE!! Use Minitab Statistical Software TWO DATA SETS Time intervals between oil spills in an inland

PLEASE USE MINITAB TO SOLVE AND EXPLAIN ALL STEPS PLEASE!! PLEASE USE MINITAB TO SOLVE AND EXPLAIN ALL STEPS
Use Minitab Statistical Software TWO DATA SETS Time intervals between oil spills in an inland waterway (Days) Before Pollution Controls After Pollution Controls 5 11 37 23 25 7 2 3 24 3 2 19 36 15 1 21 1 2 22 20 36 23 15 3 6 56 17 31 14 76 21 7 39 5 35 33 5 1 9 7 9 5 27 13 32 6 5 27 7 0 27 29 31 7 14 15 1 5 0 5 1 1 12 7 21 36 6 120 21 87 33 0 64 12 4 33 1 22 48 12 1 18 27 10 38 12 45 32 34 20 1 36 28 49 33 2 51 19 1 11 4 31 2 161 1 9 10 13 17 11 5 2 5 18 18 14 3 32 9 1 1 131 34 74 21 12 27 3 1 15 4 12 163 2 21 0 1 135 9 6 45 1 3 Answer the following questions (a-j) for both data sets: a) Create an ordered array. b) Find the sample mean (X), sample median, mode, range, sample variance, and standard deviation (S). c) Find the fraction of measurements lying in the interval X S. d) Find the fraction of measurements lying in the interval X + 2S. e) Find the 25th percentile, 60th percentile, and 75th percentile. f) Find the respective coefficients of variation. Compare the results. g) Find the standardized values for each observation. Show the mean and the standard deviation of the standardized values. h) Construct a frequency distribution using 10 classes and draw a histogram and frequency polygon. i) What is the modal class? 1) From part h, do you think the distribution of the data sets are symmetric or skewed either to the right or to the left. Why? k) Summarize and compare the results of the two data sets. Use the box-and-Whisker plot and list the five- number summary Use Minitab Statistical Software TWO DATA SETS Time intervals between oil spills in an inland waterway (Days) Before Pollution Controls After Pollution Controls 5 11 37 23 25 7 2 3 24 3 2 19 36 15 1 21 1 2 22 20 36 23 15 3 6 56 17 31 14 76 21 7 39 5 35 33 5 1 9 7 9 5 27 13 32 6 5 27 7 0 27 29 31 7 14 15 1 5 0 5 1 1 12 7 21 36 6 120 21 87 33 0 64 12 4 33 1 22 48 12 1 18 27 10 38 12 45 32 34 20 1 36 28 49 33 2 51 19 1 11 4 31 2 161 1 9 10 13 17 11 5 2 5 18 18 14 3 32 9 1 1 131 34 74 21 12 27 3 1 15 4 12 163 2 21 0 1 135 9 6 45 1 3 Answer the following questions (a-j) for both data sets: a) Create an ordered array. b) Find the sample mean (X), sample median, mode, range, sample variance, and standard deviation (S). c) Find the fraction of measurements lying in the interval X S. d) Find the fraction of measurements lying in the interval X + 2S. e) Find the 25th percentile, 60th percentile, and 75th percentile. f) Find the respective coefficients of variation. Compare the results. g) Find the standardized values for each observation. Show the mean and the standard deviation of the standardized values. h) Construct a frequency distribution using 10 classes and draw a histogram and frequency polygon. i) What is the modal class? 1) From part h, do you think the distribution of the data sets are symmetric or skewed either to the right or to the left. Why? k) Summarize and compare the results of the two data sets. Use the box-and-Whisker plot and list the five- number summary

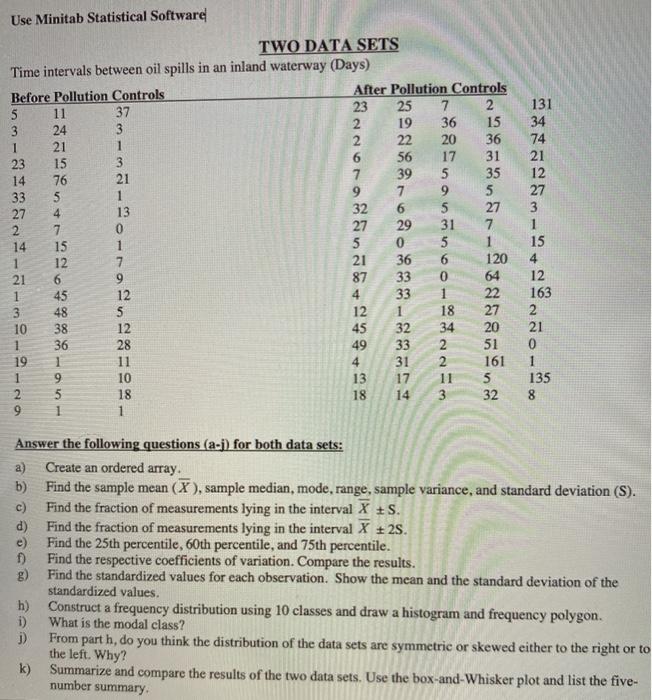
Step by Step Solution

There are 3 Steps involved in it

1 Expert Approved Answer
Step: 1 Unlock blur-text-image
Question Has Been Solved by an Expert!

Get step-by-step solutions from verified subject matter experts

Step: 2 Unlock
Step: 3 Unlock

Students Have Also Explored These Related General Management Questions!