

Question: Please use Minitab with data below, when I do the Tsq - GV option I get an error that says Graph cannot be created because
Please use Minitab with data below, when I do the TsqGV option I get an error that says "Graph cannot be created because there are no valid data"
If I use Tsq i get a graph
In an electrolysis process, electrical current passes through a concentration of brine solution where
anode and cathode are separated by a porous diaphragm. Chlorine is displaced as a gas and the
remaining waterbrine solution contains the caustic. The following variables are used to jointly
control the process: caustic salt two kinds of impurities and and cell
gases and The target values for the mean vector are
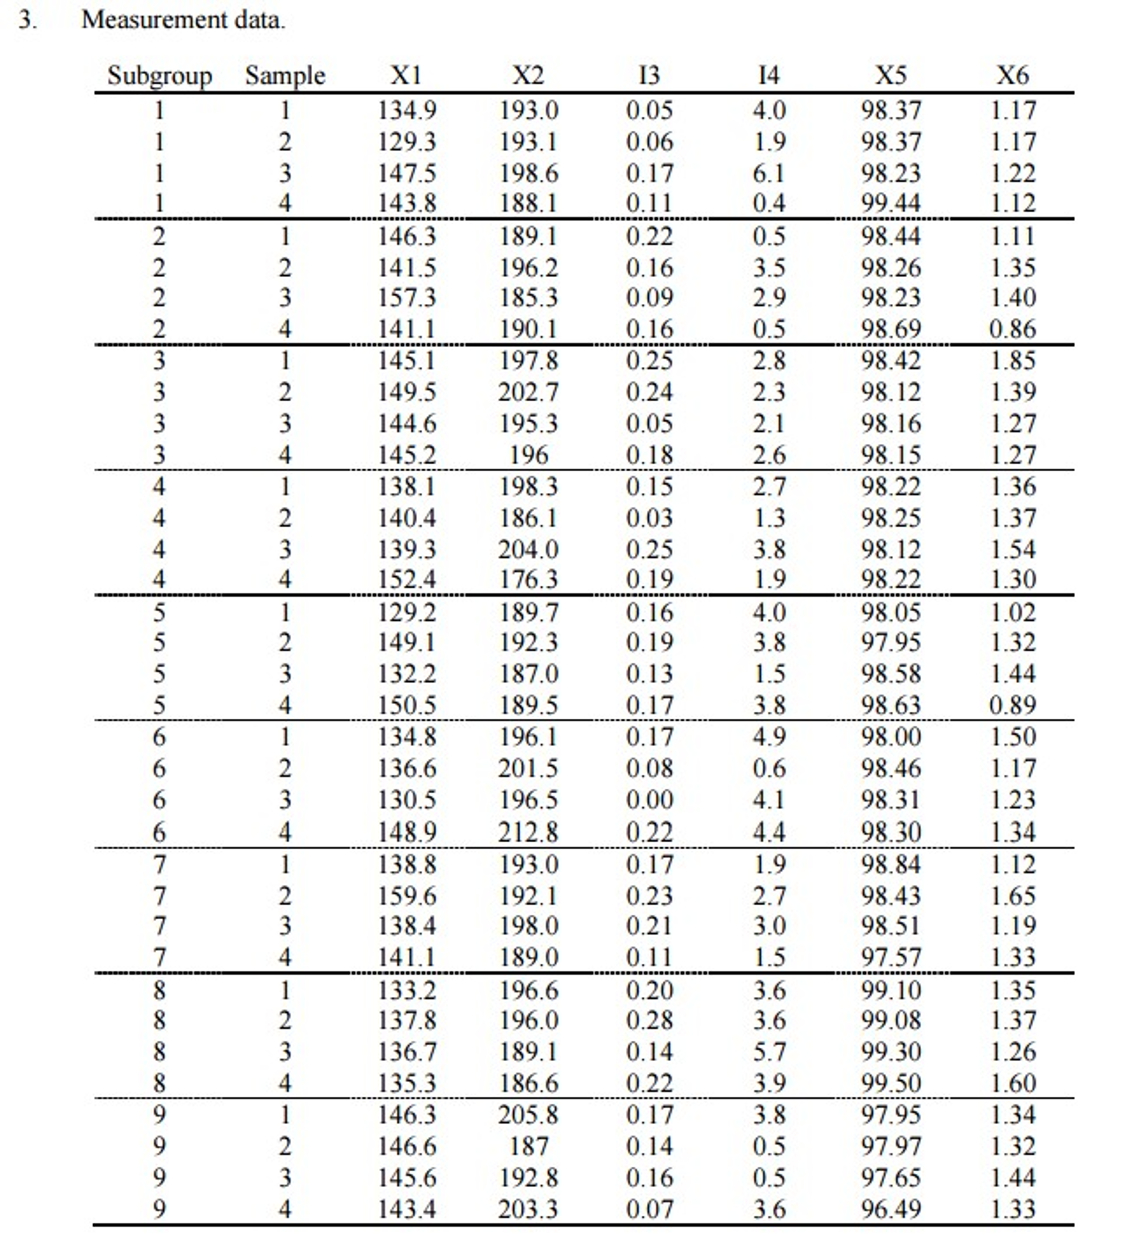
The data for the phase I control chart are in the following table. a Create the phase one
control chart using the following Minitab commands and comment on the state of control. If any
vectors are out of control, omit them and reestimate the control chart. What is the one
observable difference between a phase one control chart and a phase one Shewhart Xbar
control chart? b Create a phase one MEWMA control chart on the incontrol data from the
control chart using Does the process show any steps or drifts?
Stat Control Charts Multivariate Charts Tsquared
In the "Variables:" input box select Pb X Pb X Pb I Pb I Pb X Pb X with a single
space between each variable name.
In the "Subgroup sizes:" input box select PBSubgp
Click on the TsqGV Options button. On the "Parameters" tab, type in the mean vector
values above with a single space between each mean value.
Click the OK and OK buttons.
Step by Step Solution
There are 3 Steps involved in it
1 Expert Approved Answer
Step: 1 Unlock

Question Has Been Solved by an Expert!
Get step-by-step solutions from verified subject matter experts
Step: 2 Unlock
Step: 3 Unlock