

Question: Please use python. 3. For a new iris data sample S with a feature vector of [5.0000, 3.5000, 1.4600, 0.2540), calculate the distances between the
 Please use python.
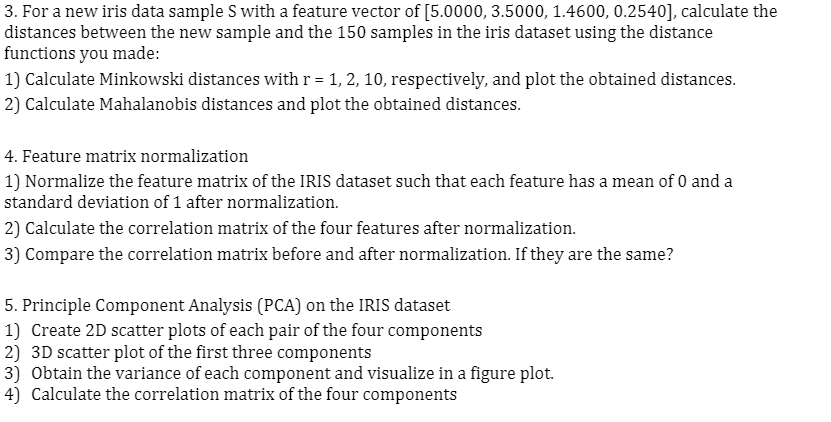
3. For a new iris data sample S with a feature vector of [5.0000, 3.5000, 1.4600, 0.2540), calculate the distances between the new sample and the 150 samples in the iris dataset using the distance functions you made: 1) Calculate Minkowski distances with r = 1, 2, 10, respectively, and plot the obtained distances. 2) Calculate Mahalanobis distances and plot the obtained distances. 4. Feature matrix normalization 1) Normalize the feature matrix of the IRIS dataset such that each feature has a mean of O and a standard deviation of 1 after normalization. 2) Calculate the correlation matrix of the four features after normalization. 3) Compare the correlation matrix before and after normalization. If they are the same? 5. Principle Component Analysis (PCA) on the IRIS dataset 1) Create 2D scatter plots of each pair of the four components 2) 3D scatter plot of the first three components 3) Obtain the variance of each component and visualize in a figure plot. 4) Calculate the correlation matrix of the four components 3. For a new iris data sample S with a feature vector of [5.0000, 3.5000, 1.4600, 0.2540), calculate the distances between the new sample and the 150 samples in the iris dataset using the distance functions you made: 1) Calculate Minkowski distances with r = 1, 2, 10, respectively, and plot the obtained distances. 2) Calculate Mahalanobis distances and plot the obtained distances. 4. Feature matrix normalization 1) Normalize the feature matrix of the IRIS dataset such that each feature has a mean of O and a standard deviation of 1 after normalization. 2) Calculate the correlation matrix of the four features after normalization. 3) Compare the correlation matrix before and after normalization. If they are the same? 5. Principle Component Analysis (PCA) on the IRIS dataset 1) Create 2D scatter plots of each pair of the four components 2) 3D scatter plot of the first three components 3) Obtain the variance of each component and visualize in a figure plot. 4) Calculate the correlation matrix of the four components
Step by Step Solution
There are 3 Steps involved in it

Get step-by-step solutions from verified subject matter experts