

Question: Please use Python. Along with the problem, I have attached the ground.dat file for your reference. Problem 4 (5 pts) Read the file 'ground.dat'. The
Please use Python. Along with the problem, I have attached the ground.dat file for your reference.
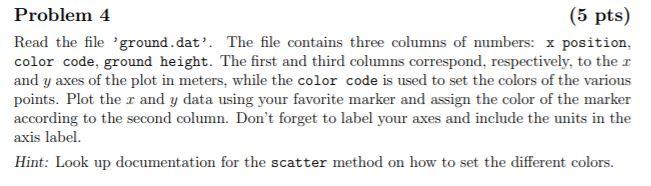
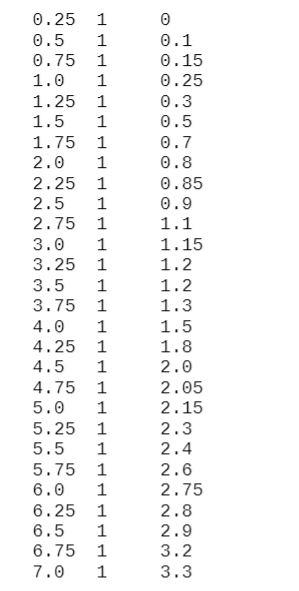
Problem 4 (5 pts) Read the file 'ground.dat'. The file contains three columns of numbers: x position, color code, ground height. The first and third columns correspond, respectively, to the r and y axes of the plot in meters, while the color code is used to set the colors of the various points. Plot the r and y data using your favorite marker and assign the color of the marker according to the second column. Don't forget to label your axes and include the units in the axis label. Hint: Look up documentation for the scatter method on how to set the different colors. 0.25 1 0.5 1 0.75 1 1.0 1 1.25 1 1.5 1 1.75 1 2.0 1 2.25 1 2.5 1 2.75 1 3.0 1 3.25 1 3.5 1 3.75 1 4.0 1 4.25 1 4.5 1 4.75 1 5.0 1 5.25 1 5.5 1 5.75 1 6.0 1 6.25 1 6.5 1 6.75 1 7.0 1 0 0.1 0.15 0.25 0.3 0.5 0.7 0.8 0.85 0.9 1.1 1.15 1.2 1.2 1.3 1.5 1.8 2.0 2.05 2.15 2.3 2.4 2.6 2.75 2.8 2.9 3.2 3.3
Step by Step Solution
There are 3 Steps involved in it

Get step-by-step solutions from verified subject matter experts