

Question: PLEASE USE PYTHON Below we use the pocket algorithm to find a linear separator w for the breast cancer data and then output its E_in
PLEASE USE PYTHON
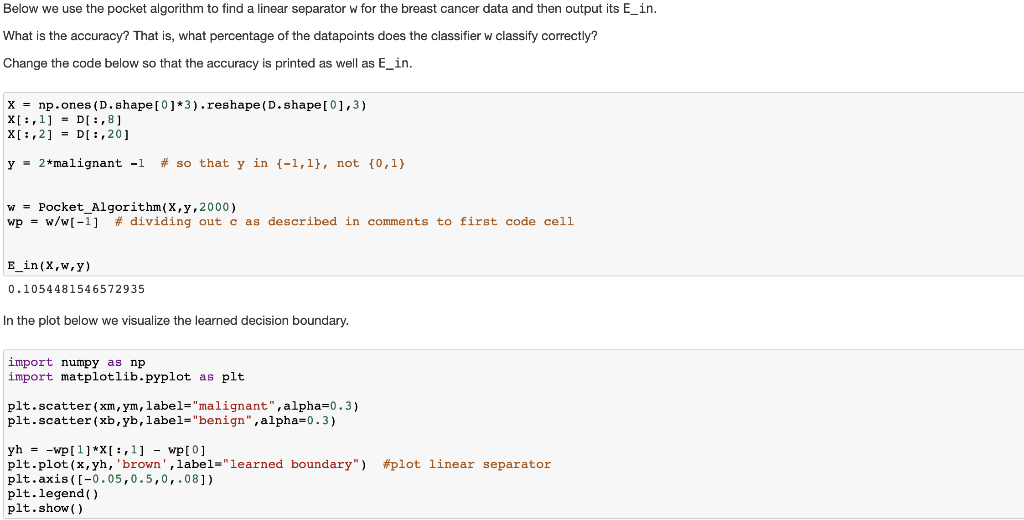
Below we use the pocket algorithm to find a linear separator w for the breast cancer data and then output its E_in What is the accuracy? That is, what percentage of the datapoints does the classifier W classify correctly? Change the code below so that the accuracy is printed as well as E_in Xnp.ones (D.shape[ 01*3).reshape (D.shape I 0,3) y- 2*malignant -1 # so that y in {-1,1), not {0,1} w - Pocket_Algorithm (X,y,2000) wp-w/w[-1] # dividing out c as described in comments to first code cell E-in ( x,w,y) 0.1054481546572935 In the plot below we visualize the learned decision boundary. import numpy as np import matplotlib.pyplot as plt plt.scatter (xm, ym, label-"malignant", alpha-0.3) plt.scatter (xb,yb, label-"benign" ,alpha-0.3) plt.plot ( x , yh, 'brown. 1abel.'' learned plt.axis (-0.05,0.5,0,.081) plt.legend() plt.show () boundary") #plot linear separator Below we use the pocket algorithm to find a linear separator w for the breast cancer data and then output its E_in What is the accuracy? That is, what percentage of the datapoints does the classifier W classify correctly? Change the code below so that the accuracy is printed as well as E_in Xnp.ones (D.shape[ 01*3).reshape (D.shape I 0,3) y- 2*malignant -1 # so that y in {-1,1), not {0,1} w - Pocket_Algorithm (X,y,2000) wp-w/w[-1] # dividing out c as described in comments to first code cell E-in ( x,w,y) 0.1054481546572935 In the plot below we visualize the learned decision boundary. import numpy as np import matplotlib.pyplot as plt plt.scatter (xm, ym, label-"malignant", alpha-0.3) plt.scatter (xb,yb, label-"benign" ,alpha-0.3) plt.plot ( x , yh, 'brown. 1abel.'' learned plt.axis (-0.05,0.5,0,.081) plt.legend() plt.show () boundary") #plot linear separator
Step by Step Solution
There are 3 Steps involved in it

Get step-by-step solutions from verified subject matter experts