

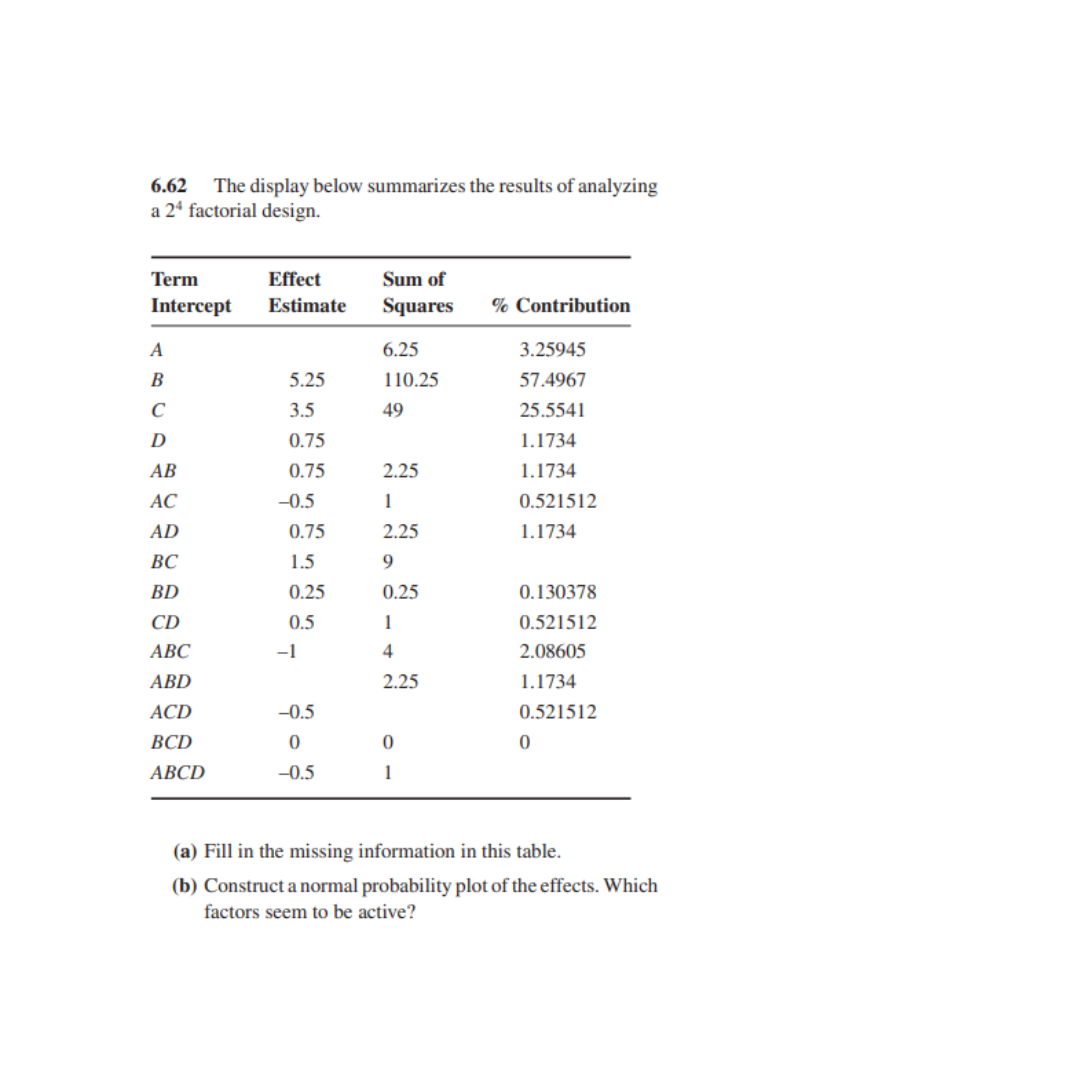
Question: Please use python code only. 6 . 6 2 The display below summarizes the results of analyzing a 2 4 factorial design. table [
Please use python code only. The display below summarizes the results of analyzing a factorial design.
tabletableTermIntercepttableEffectEstimatetableSum ofSquares Contribution
a Fill in the missing information in this table.
b Construct a normal probability plot of the effects. Which factors seem to be active?
Step by Step Solution
There are 3 Steps involved in it
1 Expert Approved Answer
Step: 1 Unlock

Question Has Been Solved by an Expert!
Get step-by-step solutions from verified subject matter experts
Step: 2 Unlock
Step: 3 Unlock