

Question: PLEASE USE PYTHON!! Modify plot5.py to plot tangent of X over the range (-pi/2, pi/2) in green lines. Set y limits to [-10.0, 10.0]. plot5.py
PLEASE USE PYTHON!!
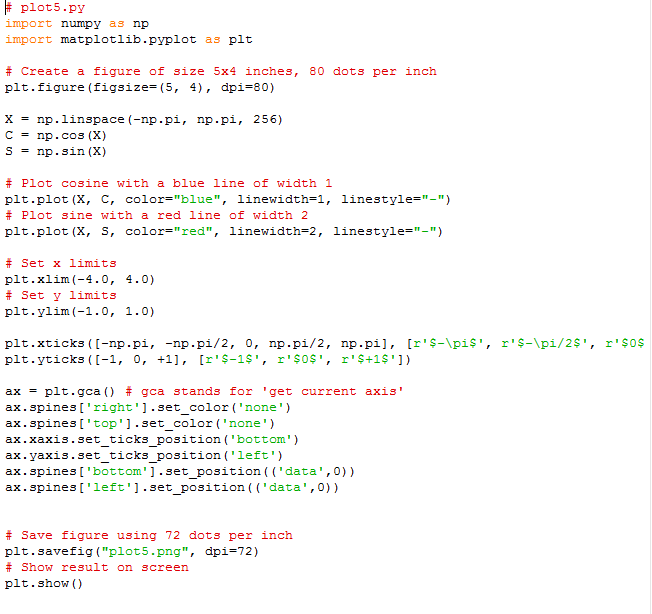
Modify plot5.py to plot tangent of X over the range (-pi/2, pi/2) in green lines. Set y limits to [-10.0, 10.0].
plot5.py import numpy a3 np import matplotlib.pyplot as plt # Create a figure of size 5x4 inches, 80 dots per inch plt.figure (figsize-(5, 4), dpi-80) X = np.linspace(-np .pi, C-np.cos (X) S = np. sin (X) np .pi, 256) # Plot cosine with a blue line of width 1 plt.plot (X, C, color-"blue", linewidth-1, linestyle-"-") # Plot 3ine with a red line of width 2 plt.plot (X, S, color-"red", linewidth-2, linestyle-"-") # Set x limits plt.xlim (-4.0, 4.0) # set y limits plt.ylim(-1.0, 1.0) plt.yticks (I-1, 0, +1], [r's-1s, r'S0$', r'$+1s') ax = pt.gca() # gca 3tands for 'get current ax. spines [ ' right' ] set color ( ' none ' ) ax . 3pines [ ' top' ] setcolor ( none' ) ax. xaxis. 3etticksposition ( 'bottom') ax . yaxis. 3etticksposition ( ' left' ) ax.spines['bottom' ].set position ('data',0)) ax. spines [ ' left ' ] set position ( ( ' data ' , 0) ) axis' - - - - - # Save figure using 72 dots per inch plt.save fig ("plot5.png", dp#72) # Show re3ult on 3creen plt.show () plot5.py import numpy a3 np import matplotlib.pyplot as plt # Create a figure of size 5x4 inches, 80 dots per inch plt.figure (figsize-(5, 4), dpi-80) X = np.linspace(-np .pi, C-np.cos (X) S = np. sin (X) np .pi, 256) # Plot cosine with a blue line of width 1 plt.plot (X, C, color-"blue", linewidth-1, linestyle-"-") # Plot 3ine with a red line of width 2 plt.plot (X, S, color-"red", linewidth-2, linestyle-"-") # Set x limits plt.xlim (-4.0, 4.0) # set y limits plt.ylim(-1.0, 1.0) plt.yticks (I-1, 0, +1], [r's-1s, r'S0$', r'$+1s') ax = pt.gca() # gca 3tands for 'get current ax. spines [ ' right' ] set color ( ' none ' ) ax . 3pines [ ' top' ] setcolor ( none' ) ax. xaxis. 3etticksposition ( 'bottom') ax . yaxis. 3etticksposition ( ' left' ) ax.spines['bottom' ].set position ('data',0)) ax. spines [ ' left ' ] set position ( ( ' data ' , 0) ) axis' - - - - - # Save figure using 72 dots per inch plt.save fig ("plot5.png", dp#72) # Show re3ult on 3creen plt.show ()
Step by Step Solution
There are 3 Steps involved in it

Get step-by-step solutions from verified subject matter experts