

Question: please use python to solve it. thank you Problem 1: Make the following array of plots: Create the following function: z=xsin(x)exp(y2) use 3D surface plot
please use python to solve it. thank you
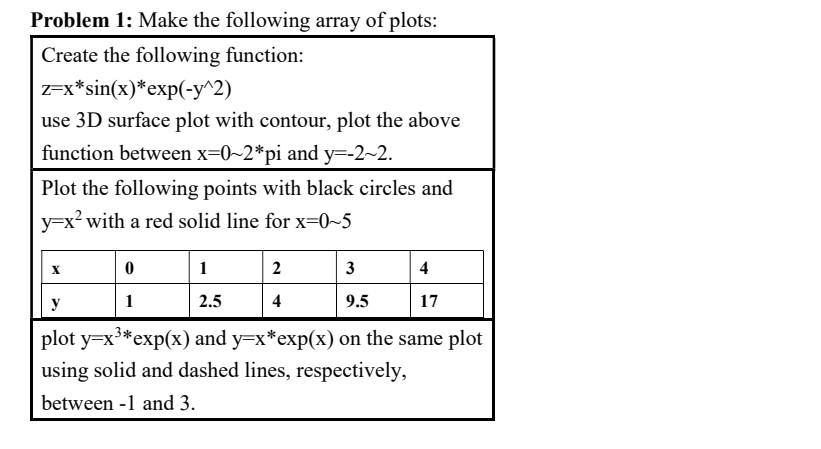
Problem 1: Make the following array of plots: Create the following function: z=xsin(x)exp(y2) use 3D surface plot with contour, plot the above function between x=02 pi and y=22. Plot the following points with black circles and y=x2 with a red solid line for x=05 \begin{tabular}{|l|l|l|l|l|l|} \hline x & 0 & 1 & 2 & 3 & 4 \\ \hline y & 1 & 2.5 & 4 & 9.5 & 17 \\ \hline \end{tabular} using solid and dashed lines, respectively, between 1 and 3
Step by Step Solution
There are 3 Steps involved in it
1 Expert Approved Answer
Step: 1 Unlock

Question Has Been Solved by an Expert!
Get step-by-step solutions from verified subject matter experts
Step: 2 Unlock
Step: 3 Unlock