

Question: Please use R language or Python, to complete the code to generate a Manhattan plot for the following Genome Wide Association Studies assignment. (R language
Please use R language or Python, to complete the code to generate a Manhattan plot for the following Genome Wide Association Studies assignment. (R language proides a package called QQMan that makes the Manhattan Plot creation way easier.) I struggled with formatting my data properly. The link to download the specified datasets are here: https://files.fm/u/ktxb65pu
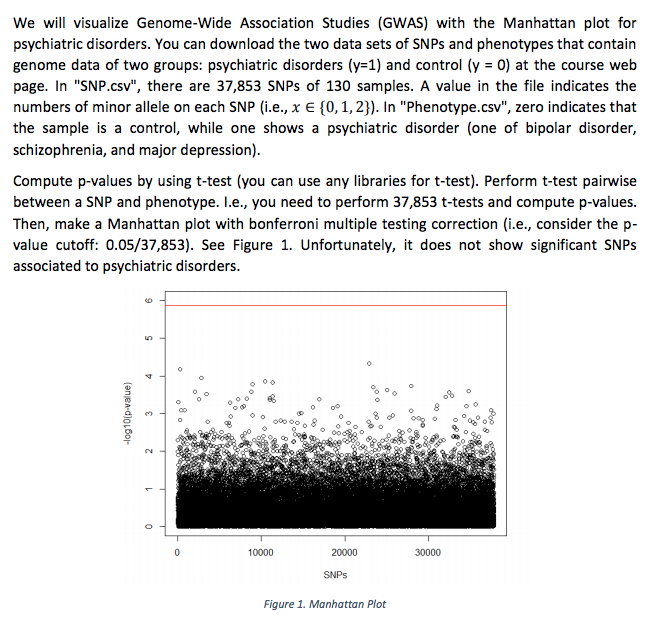
We wil visualize Genome-Wide Association Studies (GWAS) with the Manhattan plot for psychiatric disorders. You can download the two data sets of SNPs and phenotypes that contain genome data of two groups: psychiatric disorders (y-1) and control (y 0) at the course web page. In "SNP.csv", there are 37,853 SNPs of 130 samples. A value in the file indicates the numbers of minor allele on each SNP (i.e., x E f0,1,23). In "Phenotype.csv", zero indicates that the sample is a control, while one shows a psychiatric disorder (one of bipolar disorder, schizophrenia, and major depression) Compute p-values by using t-test (you can use any libraries for t-test). Perform t-test pairwise between a SNP and phenotype. I.?., you need to perform 37,853 t-tests and compute p-values. Then, make a Manhattan plot with bonferroni multiple testing correction (i.e., consider the p- value cutoff: 0.05/37,853). See Figure 1. Unfortunately, it does not show significant SNPs associated to psychiatric disorders 10000 20000 30000 SNPs Figure 1. Manhattan Plot We wil visualize Genome-Wide Association Studies (GWAS) with the Manhattan plot for psychiatric disorders. You can download the two data sets of SNPs and phenotypes that contain genome data of two groups: psychiatric disorders (y-1) and control (y 0) at the course web page. In "SNP.csv", there are 37,853 SNPs of 130 samples. A value in the file indicates the numbers of minor allele on each SNP (i.e., x E f0,1,23). In "Phenotype.csv", zero indicates that the sample is a control, while one shows a psychiatric disorder (one of bipolar disorder, schizophrenia, and major depression) Compute p-values by using t-test (you can use any libraries for t-test). Perform t-test pairwise between a SNP and phenotype. I.?., you need to perform 37,853 t-tests and compute p-values. Then, make a Manhattan plot with bonferroni multiple testing correction (i.e., consider the p- value cutoff: 0.05/37,853). See Figure 1. Unfortunately, it does not show significant SNPs associated to psychiatric disorders 10000 20000 30000 SNPs Figure 1. Manhattan Plot
Step by Step Solution
There are 3 Steps involved in it

Get step-by-step solutions from verified subject matter experts