

Question: Please use R language. The table below and the data file give ht = height in centimeters and wt = weight in kilograms for a
Please use R language.
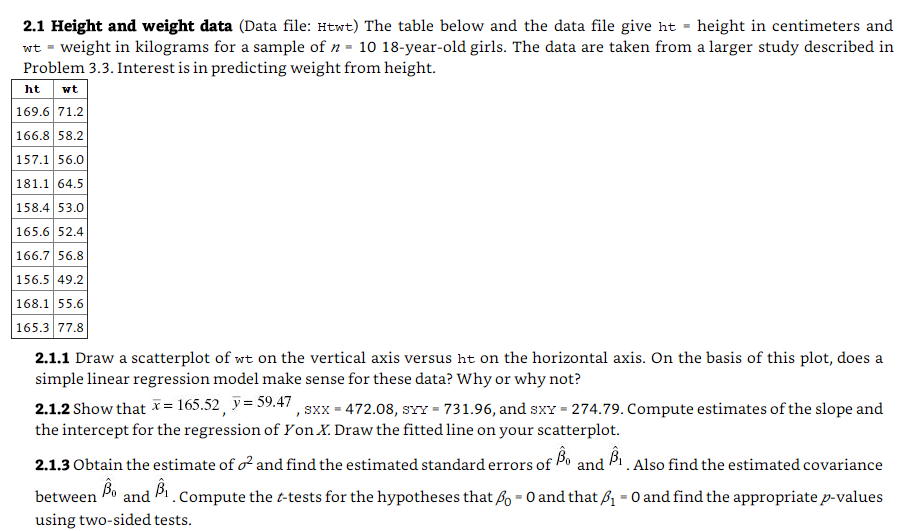
The table below and the data file give ht = height in centimeters and wt = weight in kilograms for a sample of n = 10 18-year-old girls. The data are taken from a larger study described in Problem 3.3. Interest is in predicting weight from height. Draw a scatterplot of wt on the vertical axis versus ht on the horizontal axis. On the basis of this plot, does a simple linear regression model make sense for these data? Why or why not? Show that x bar = 165.52 y bar = 59.47 SXX = 472.08, SYY = 731.96, and SXY = 274.79. Compute estimates of the slope and the intercept for the regression of Yon X. Draw the fitted line on your scatterplot. Obtain the estimate of gigma^2 and find the estimated standard errors of cap beta_0 and cap beta_1. Also find the estimated covariance between cap beta_0 and cap beta_1. Compute the t-tests for the hypotheses that beta_0 = 0 and that beta_1 = 0 and find the appropriate p-values using two-sided tests
Step by Step Solution
There are 3 Steps involved in it

Get step-by-step solutions from verified subject matter experts