

Question: Please use R or R Studio for the following questions. 1.1. Access the Salaries dataset by using the code: library(car); library(carData); data(Salaries) Plot salary vs.
Please use R or R Studio for the following questions.
1.1. Access the Salaries dataset by using the code: library(car); library(carData); data(Salaries)
Plot salary vs. years since PhD. What's your interpretation?
1.2. What is the correlation for salary vs. years since PhD? Is it statistically significant?
1.3. What is the correlation for salary vs. years of service? Is it statistically significant?
1.4. Draw a visualization of all bivariate relationships.
1.5. Check skewness of "salary" variable that is a dependent variable of your regression model. Should it be transformed? If so, how?
1.6. Run a linear regression model that predicts salary (DV: salary) based on the number of service years (IV: yrs.service). And interpret your results of the above regression analysis. Hint: Focus on (1) estimated coefficient and (2) R-squared.
1.7. If a new professor who has 10-year experience of service joins ISU next semester, then your prediction based on the model of her/his salary is...?
1.8. Run a linear regression model (model.1) that predicts salary (DV: salary) based on the following independent variables, yrs.since.phd, yrs.service, sex, rank, discipline. And interpret your results of the above regression analysis. Hint: Focus on (1) estimated coefficients, (2) R-squared, and (3) Adjusted R-squared.
1.9. Check "multicollinearity" in the model.1 by using Variance Inflation Factor (VIF).
1.10. Run a linear regression model (model.2) by dropping a variable whose VIF or GVIF is the highest from model.1. And interpret your results of the above regression analysis. Hint: Focus on (1) estimated coefficients, (2) R-squared, and (3) Adjusted R-squared.
1.11. Compare the two models (i.e., model.1 and model.2) by using (1) R-squared & Adjusted R-squared, (2) visualization, and (3) formal statistical test.
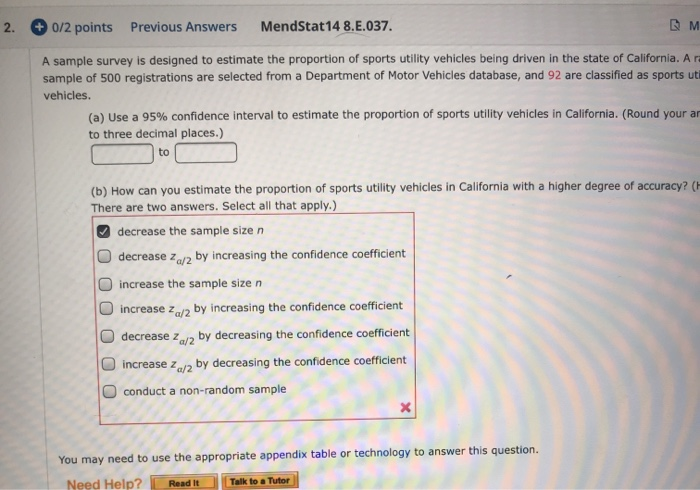
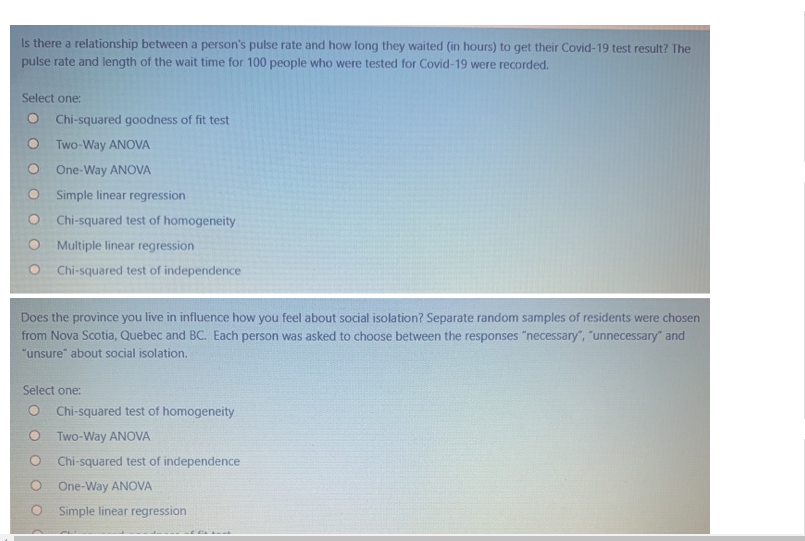
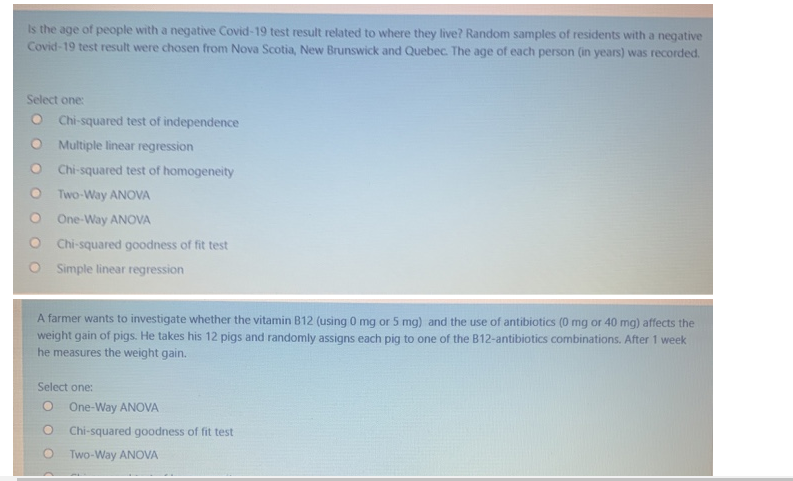
2. + 0/2 points Previous Answers MendStat14 8.E.037. & M A sample survey is designed to estimate the proportion of sports utility vehicles being driven in the state of California. A r sample of 500 registrations are selected from a Department of Motor Vehicles database, and 92 are classified as sports ut vehicles. (a) Use a 95% confidence interval to estimate the proportion of sports utility vehicles in California. (Round your ar to three decimal places.) to (b) How can you estimate the proportion of sports utility vehicles in California with a higher degree of accuracy? ( There are two answers. Select all that apply.) decrease the sample size n O decrease Za/2 by increasing the confidence coefficient O increase the sample size n increase z /2 by increasing the confidence coefficient decrease z /2 by decreasing the confidence coefficient increase za/2 by decreasing the confidence coefficient O conduct a non-random sample You may need to use the appropriate appendix table or technology to answer this question. Need Help? Read It Talk to a TutorIs there a relationship between a person's pulse rate and how long they waited (in hours) to get their Covid-19 test result? The pulse rate and length of the wait time for 100 people who were tested for Covid-19 were recorded. Select one: O Chi-squared goodness of fit test O Two-Way ANOVA O One-Way ANOVA Simple linear regression O Chi-squared test of homogeneity O Multiple linear regression O Chi-squared test of independence Does the province you live in influence how you feel about social isolation? Separate random samples of residents were chosen from Nova Scotia, Quebec and BC. Each person was asked to choose between the responses "necessary", "unnecessary" and "unsure" about social isolation. Select one: O Chi-squared test of homogeneity O Two-Way ANOVA O Chi-squared test of independence O One-Way ANOVA O Simple linear regressionIs the age of people with a negative Covid-19 test result related to where they live? Random samples of residents with a negative Covid-19 test result were chosen from Nova Scotia, New Brunswick and Quebec. The age of each person (in years) was recorded. Select one: O Chi-squared test of independence O Multiple linear regression O Chi-squared test of homogeneity O Two-Way ANOVA O One-Way ANOVA O Chi-squared goodness of fit test O Simple linear regression A farmer wants to investigate whether the vitamin B12 (using 0 mg or 5 mg) and the use of antibiotics (0 mg or 40 mg) affects the weight gain of pigs. He takes his 12 pigs and randomly assigns each pig to one of the B12-antibiotics combinations. After 1 week he measures the weight gain. Select one: O One-Way ANOVA O Chi-squared goodness of fit test O Two-Way ANOVA
Step by Step Solution
There are 3 Steps involved in it

Get step-by-step solutions from verified subject matter experts