

Question: Please use R Programming for the following question: Question 1: a. 'v'isualize the distributions of the variables in this data. You can choose bar graphs,
Please use R Programming for the following question:
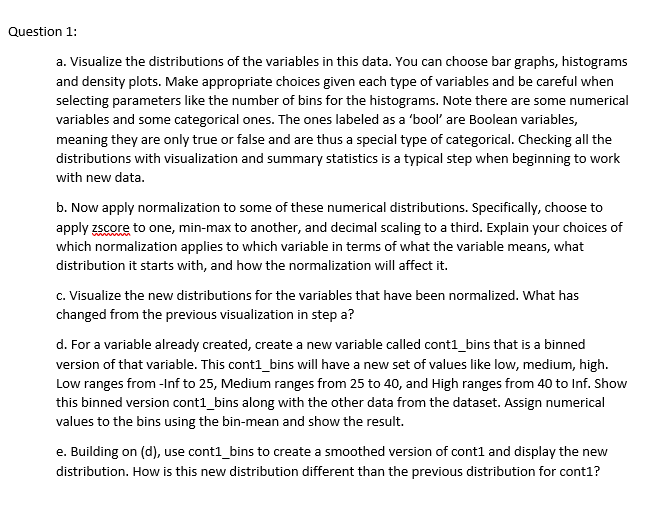
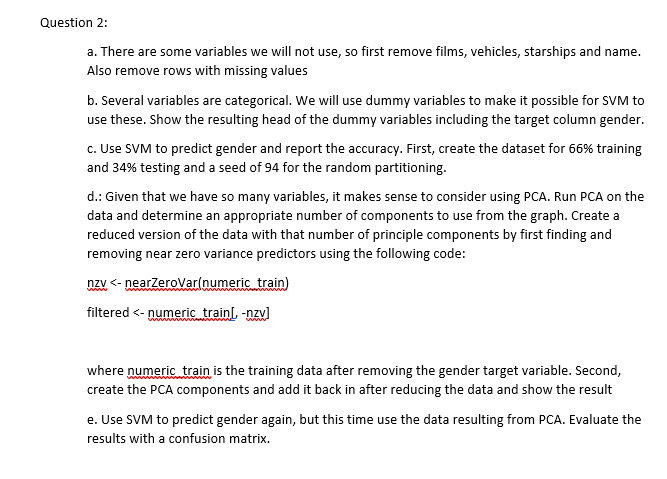
Question 1: a. 'v'isualize the distributions of the variables in this data. You can choose bar graphs, histograms and density plots. Make appropriate choices given each type of variables and be careful when selecting parameters like the number of bins for the histograms. Note there are some numerical variables and some categorical ones. The ones labeled as a 'bool' are Boolean variables, meaning they are only true or false and are thus a special type of categorical. Checki ng all the distributions with visualization and summary statistics is a typical step when beginning to work with new data. b. How apply normalization to some of these numerical distributions. Specically, choose to apply zscore to one, min-max to another, and decimal scaling to a third. Explain your choices of which nomtalization applies to which variable in terms of what the variable means, what distribution it starts with, and how the normalization will affect it. c. 1lilisualize the new distributions for the variables that have been normalized. What has changed from the previous visualization in step a? d. For a variable already created, create a new variable called cont1_bins that is a binned version of that variable. This cont1_bins will have a new set of values like low, medium, high. Low ranges from |nf to 25, Medium ranges from 25 to 40, and High ranges from an to Inf. Show this binned version cont1_bins along with the other data from the dataset. ssign numerical values to the bins using the binmean and show the result. e. Building on {d}, use cont1_bins to create a smoothed version of contl and display the new distribution. How is this new distribution different than the previous distribution for oontl? Question 2: a. There are some variables we will not use, so rst remove lms, vehicles, starships and name. Also remove rows with missing values b. Several variables are categorical. We will use dum mv variables to ma ke it possible for SUM to use these. Show the resulting head of the dummvr variables including the target oolumn gender. c. Use SUM to predict gender and report the accuracv. FUEL create the dataset for 56-96 training and 34-96 testing and a seed of 514 for the random partitioning. d.: Given that we have so many variables. it malces sense to consider using PEA. Run PEA on the data and determine an appropriate number of components to use from the graph. Create a reduced version of the data with that number of principle components bv rst nding and removing near zero variance predictors using the following code: purges nearlero'v'arinumeric train} ltered
Step by Step Solution
There are 3 Steps involved in it

Get step-by-step solutions from verified subject matter experts