Question: Please use R programming language. Please help by providing some good explanations of the steps as well. Please note I did not provide the DDT

Please use R programming language. Please help by providing some good explanations of the steps as well.

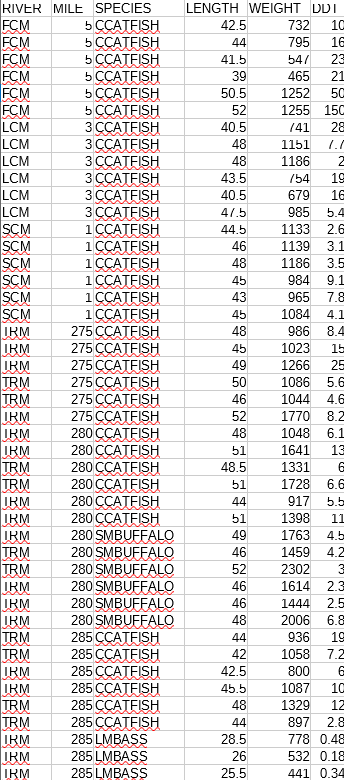
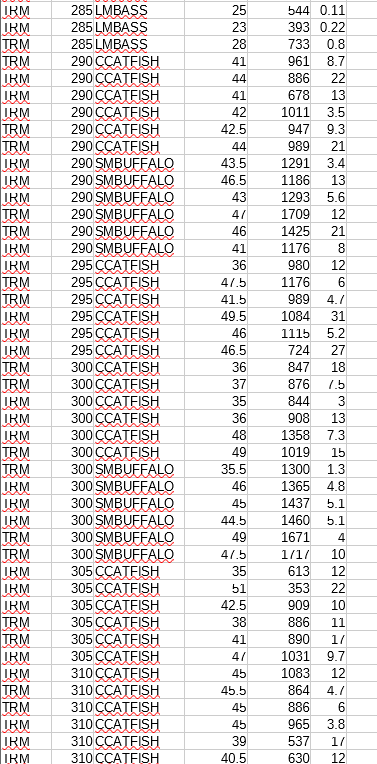
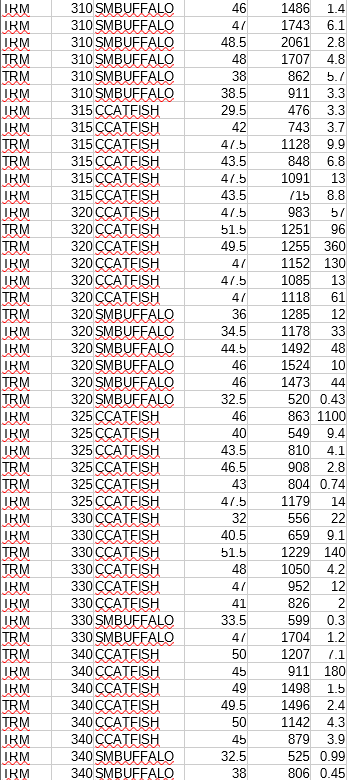
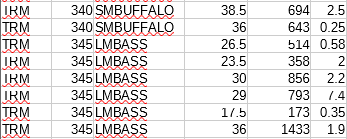
Please note I did not provide the DDT data set, but please give the code example assuming " DDT_2_ " is my actual data set.

Please use R programming language. Please help byPlease use R programming language. Please help byPlease use R programming language. Please help byPlease use R programming language. Please help byPlease use R programming language. Please help byPlease use R programming language. Please help byPlease use R programming language. Please help byPlease use R programming language. Please help byPlease use R programming language. Please help byPlease use R programming language. Please help byPlease use R programming language. Please help byPlease use R programming language. Please help byPlease use R programming language. Please help byPlease use R programming language. Please help byPlease use R programming language. Please help byPlease use R programming language. Please help by
\f\f\f\fThe Appropriate NULL and Alternate Hypotheses A metal lathe is checked periodically by quality control inspectors to determine whether it is producing machine bearings with a mean diameter of .5 inches. If the mean diameter of the bearings is larger or smaller than .5 inches, then the process is out of control and needs to be adjusted. Formulate the null and alternative hypotheses that could be used to test whether the bearing production process is out of control. If the NULL hypothesis is: Hyp:p=1058 What would be a suitable alternate hypothesis? ) H_1: mu does not equal 0.5 & H_1:mu =05 (3 H_ 1:mu= t.test(dfELENGTH, mu = 45, alternative = "less"} one Sample t-test data: dfILENGTH t = -2.8782, df = 35, p-value = 8.82255 alternative hypothesis: true mean is less than 45 95 percent confidence interval: -Inf 44,6434 sample estimates: mean of x 43,125 Use the same output to find the two-sided pvalue. Submit to 4 decimal places. The Appropriate NULL and Alternate Hypotheses (Taken from MS 8.16) Radium in soil: The Environmental Protection Agency wishes to test whether the mean amount of radium-226 in soil in a Florida county exceeds the maximum allowable amount, 4 pCi/L. What should the alternate hypothesis be set at? O H_1: mu > 4 O H_1: mu 1 The BENZENE data set & should be read into R's workspace and then an appropriate t test should be performed with correct options. What is the numerical value of Tcalc as read from the output?\fPLANT INV-QUAD Electric 204.15 Electric 0.57 Electric 62.76 Electric 89.72 Electric 0.35 Electric 85.46 Electric 0.78 Electric 0.65 Electric 44.38 Electric 9.28 Electric 78.6 Gas 0.78 Gas 16.66 Gas 74.94 Gas 0.01 Gas 0.54 Gas 23.59 Gas 88.79 Gas 0.64 Gas 0.82 Gas 91.84 Gas 7.2 Gas 66.64 Gas 0.74 Gas 64.67 Gas 165.6 Gas 0.365 Independent Samples The textbook uses the INVQUAD data & to give an example of how to perform a 2-sample t-test for the difference in population means (variances equal). A scientist was interested in discovering the sensitivity of the p-value to resampling. Use the same INVQUAD data and carry out a bootstrap confidence interval at alpha = 0.05 for the p-value under repeated sampling. The following will give you some help, notice that the code is mostly uncommented and hence you will need to interpret it. library (dplyr) library(ggplot2 inv

Step by Step Solution

There are 3 Steps involved in it

1 Expert Approved Answer
Step: 1 Unlock blur-text-image
Question Has Been Solved by an Expert!

Get step-by-step solutions from verified subject matter experts

Step: 2 Unlock
Step: 3 Unlock

Students Have Also Explored These Related Mathematics Questions!