

Question: Please use R software, data is found in the image. ( Name is Ralph ) You can enter the percentages in a variable called x
Please use R software, data is found in the image. Name is Ralph You can enter the percentages in a variable called x remember to include the zero results and you can associate names with the categories with the namesx command. Be careful to enter the names of the categories in the same order as you entered the percentages. Then you will issue the barplot command, where you will reference the variable x that contains the data and the names of the categories. In the same command, include a label for the y axis ylab and a title for the bar chart that includes your namesmain When you issue the barplot command, the chart will appear in a new window on a Mac it is called QuartzSix Americas Super Short Survey
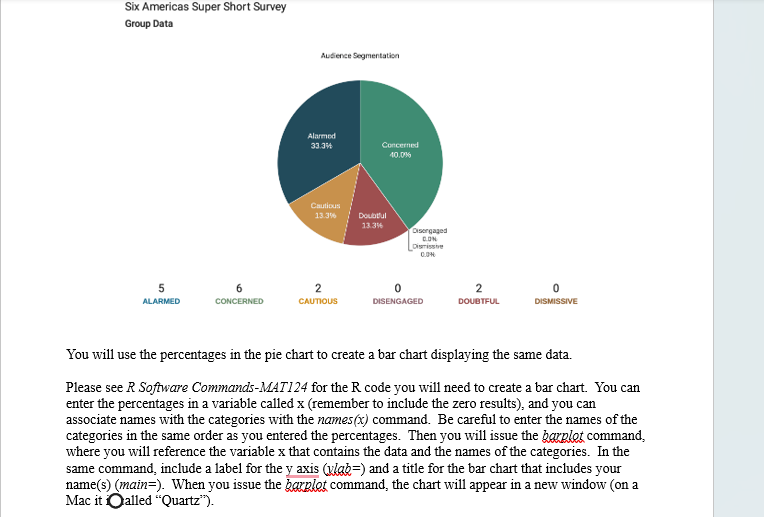
Group Data
You will use the percentages in the pie chart to create a bar chart displaying the same data.
Please see Software CommandsMAT for the code you will need to create a bar chart. You can
enter the percentages in a variable called remember to include the zero results and you can
associate names with the categories with the names command. Be careful to enter the names of the
categories in the same order as you entered the percentages. Then you will issue the barplot command,
where you will reference the variable that contains the data and the names of the categories. In the
same command, include a label for the y axis and a title for the bar chart that includes your
namesmain When you issue the barplot command, the chart will appear in a new window on a
Mac it Oalled "Quartz"
Step by Step Solution
There are 3 Steps involved in it
1 Expert Approved Answer
Step: 1 Unlock

Question Has Been Solved by an Expert!
Get step-by-step solutions from verified subject matter experts
Step: 2 Unlock
Step: 3 Unlock