

Question: PLEASE USE R STUDIO !!!!!!!!!!!!!!!!!!!!!!!!!!!!!!!!!!!!!!!!!!!!!!!!!!!!!!!!!!!!!!!!!!!!!!!!!!!!!!!!!!!!!!!!!!!!!!!! 4.7.2 Exercise 2 Consider the mtcars data set which is available in R. Type the following code to explore the
PLEASE USE R STUDIO !!!!!!!!!!!!!!!!!!!!!!!!!!!!!!!!!!!!!!!!!!!!!!!!!!!!!!!!!!!!!!!!!!!!!!!!!!!!!!!!!!!!!!!!!!!!!!!!
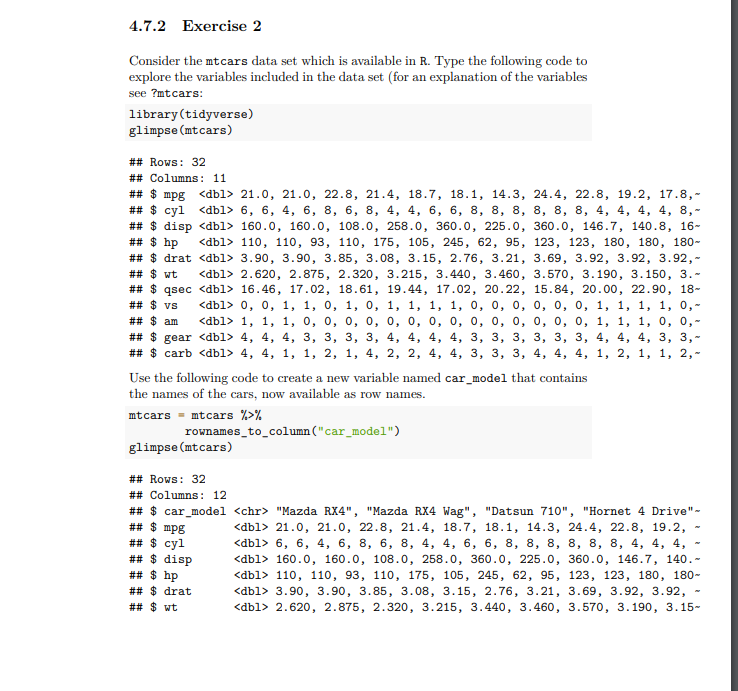
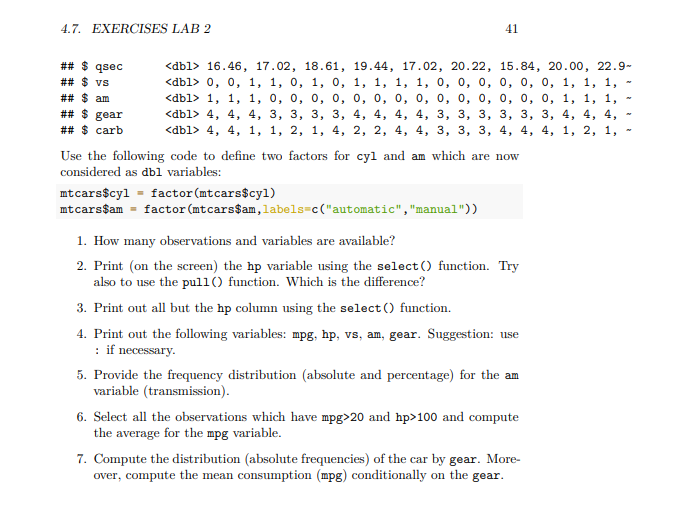
4.7.2 Exercise 2 Consider the mtcars data set which is available in R. Type the following code to explore the variables included in the data set (for an explanation of the variables see ?mtcars: library (tidyverse) glimpse (mtcars) \#\# Rows: 32 \#\# Columns: 11 \#\# \$ drat 3.90,3.90,3.85,3.08,3.15,2.76,3.21,3.69,3.92,3.92, 3.92, \#\# \$ wt dbl2.620,2.875,2.320,3.215,3.440,3.460,3.570,3.190,3.150, 3. \#\# \$ vs dbl0,0,1,1,0,1,0,1,1,1,1,0,0,0,0,0,0,1,1,1,1, 0, \#\# \$ $ am dbl1,1,1,0,0,0,0,0,0,0,0,0,0,0,0,0,0,1,1,1,0,0, \#\# \$ gear 4,4,4,3,3,3,3,4,4,4,4,3,3,3,3,3,3,4,4,4, 3, 3, \#\# \$carb 4,4,1,1,2,1,4,2,2,4,4,3,3,3,4,4,4,1,2,1, 1, 2, Use the following code to create a new variable named car_model that contains the names of the cars, now available as row names. mtcars = mtcars %> rownames_to_column( "car_model") glimpse(mtcars) \#\# Rows: 32 \#\# Columns: 12 \#\# \$car_model "Mazda RX4", "Mazda RX4 Wag", "Datsun 710", "Hornet 4 Drive" \#\# \$ $ mpg dbl21.0,21.0,22.8,21.4,18.7,18.1,14.3,24.4,22.8,19.2, \#\# \$cy1 cdbl>6,6,4,6,8,6,8,4,4,6,6,8,8,8,8,8,8,4,4,4, \#\# \$disp db1160.0,160.0,108.0,258.0,360.0,225.0,360.0,146.7, 140. \#\# \$ hp db1110,110,93,110,175,105,245,62,95,123,123,180, 180 \#\# \$ drat db1>3.90,3.90,3.85,3.08,3.15,2.76,3.21,3.69,3.92,3.92, \#\# \$ wt db12.620,2.875,2.320,3.215,3.440,3.460,3.570,3.190,3.15 4.7. EXERCISES LAB 2 41 Use the following code to define two factors for cyl and am which are now considered as dbl variables: mtcars $cy1 = factor (mtcars$cyl) mtcars $am = factor ( mtcars\$am, labels=c("automatic", "manual")) 1. How many observations and variables are available? 2. Print (on the screen) the hp variable using the select() function. Try also to use the pull () function. Which is the difference? 3. Print out all but the hp column using the select() function. 4. Print out the following variables: mpg,hp, vs, am, gear. Suggestion: use : if necessary. 5. Provide the frequency distribution (absolute and percentage) for the am variable (transmission). 6. Select all the observations which have mpg>20 and hp>100 and compute the average for the mpg variable. 7. Compute the distribution (absolute frequencies) of the car by gear. Moreover, compute the mean consumption (mpg) conditionally on the gear
Step by Step Solution
There are 3 Steps involved in it

Get step-by-step solutions from verified subject matter experts