

Question: Please use R Studio for this and provide the code for Question 2 Any other coding language will not be accepted or supported Thank you
Please use R Studio for this and provide the code for Question 2
Any other coding language will not be accepted or supported
Thank you
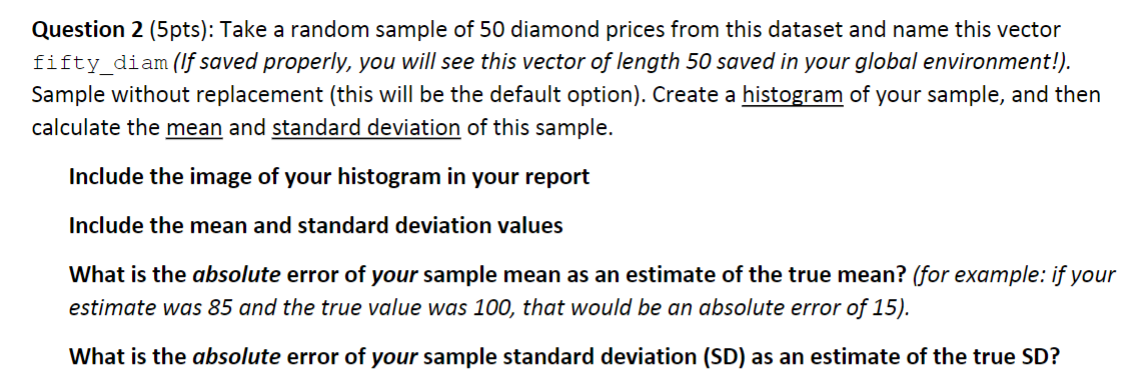
Assignment Overview - For this lab, we're going to explore distributions and the variability of a sample statistic through simulation! - To do this, we will explore the diamonds dataset saved in the ggplot2 package. This dataset has over 59,000 diamonds catalogued, and we will treat this dataset like it's a population. - Let's see how much variation we see from sample to sample and how reliable our sample statistics are in different situations! Step 0 - Pre-lab work - Complete the pre-lab tutorials for Lab 3 first: https://stat212-learnr.stat.illinois.edu/ - Open RStudio (or RStudio Cloud) to get started and open a new script. - We will be using the diamonds dataset stored in the tidyverse package. So start by running library (tidyverse) - Open the diamonds data by running the code: View (diamonds). Each row represents one diamond from a collection of over 59,000. - Take a look at the documentation for diamonds by running the code: ?diamonds Question 2 (5pts): Take a random sample of 50 diamond prices from this dataset and name this vector fifty_diam (If saved properly, you will see this vector of length 50 saved in your global environment!). Sample without replacement (this will be the default option). Create a histogram of your sample, and then calculate the mean and standard deviation of this sample. Include the image of your histogram in your report Include the mean and standard deviation values What is the absolute error of your sample mean as an estimate of the true mean? (for example: if your estimate was 85 and the true value was 100, that would be an absolute error of 15). What is the absolute error of your sample standard deviation (SD) as an estimate of the true SD
Step by Step Solution
There are 3 Steps involved in it

Get step-by-step solutions from verified subject matter experts