

Question: Please use R to answer this I cannot upload the Excel, so I copy paste the data and provide screenshot A call center is examining
Please use R to answer this
I cannot upload the Excel, so I copy paste the data and provide screenshot
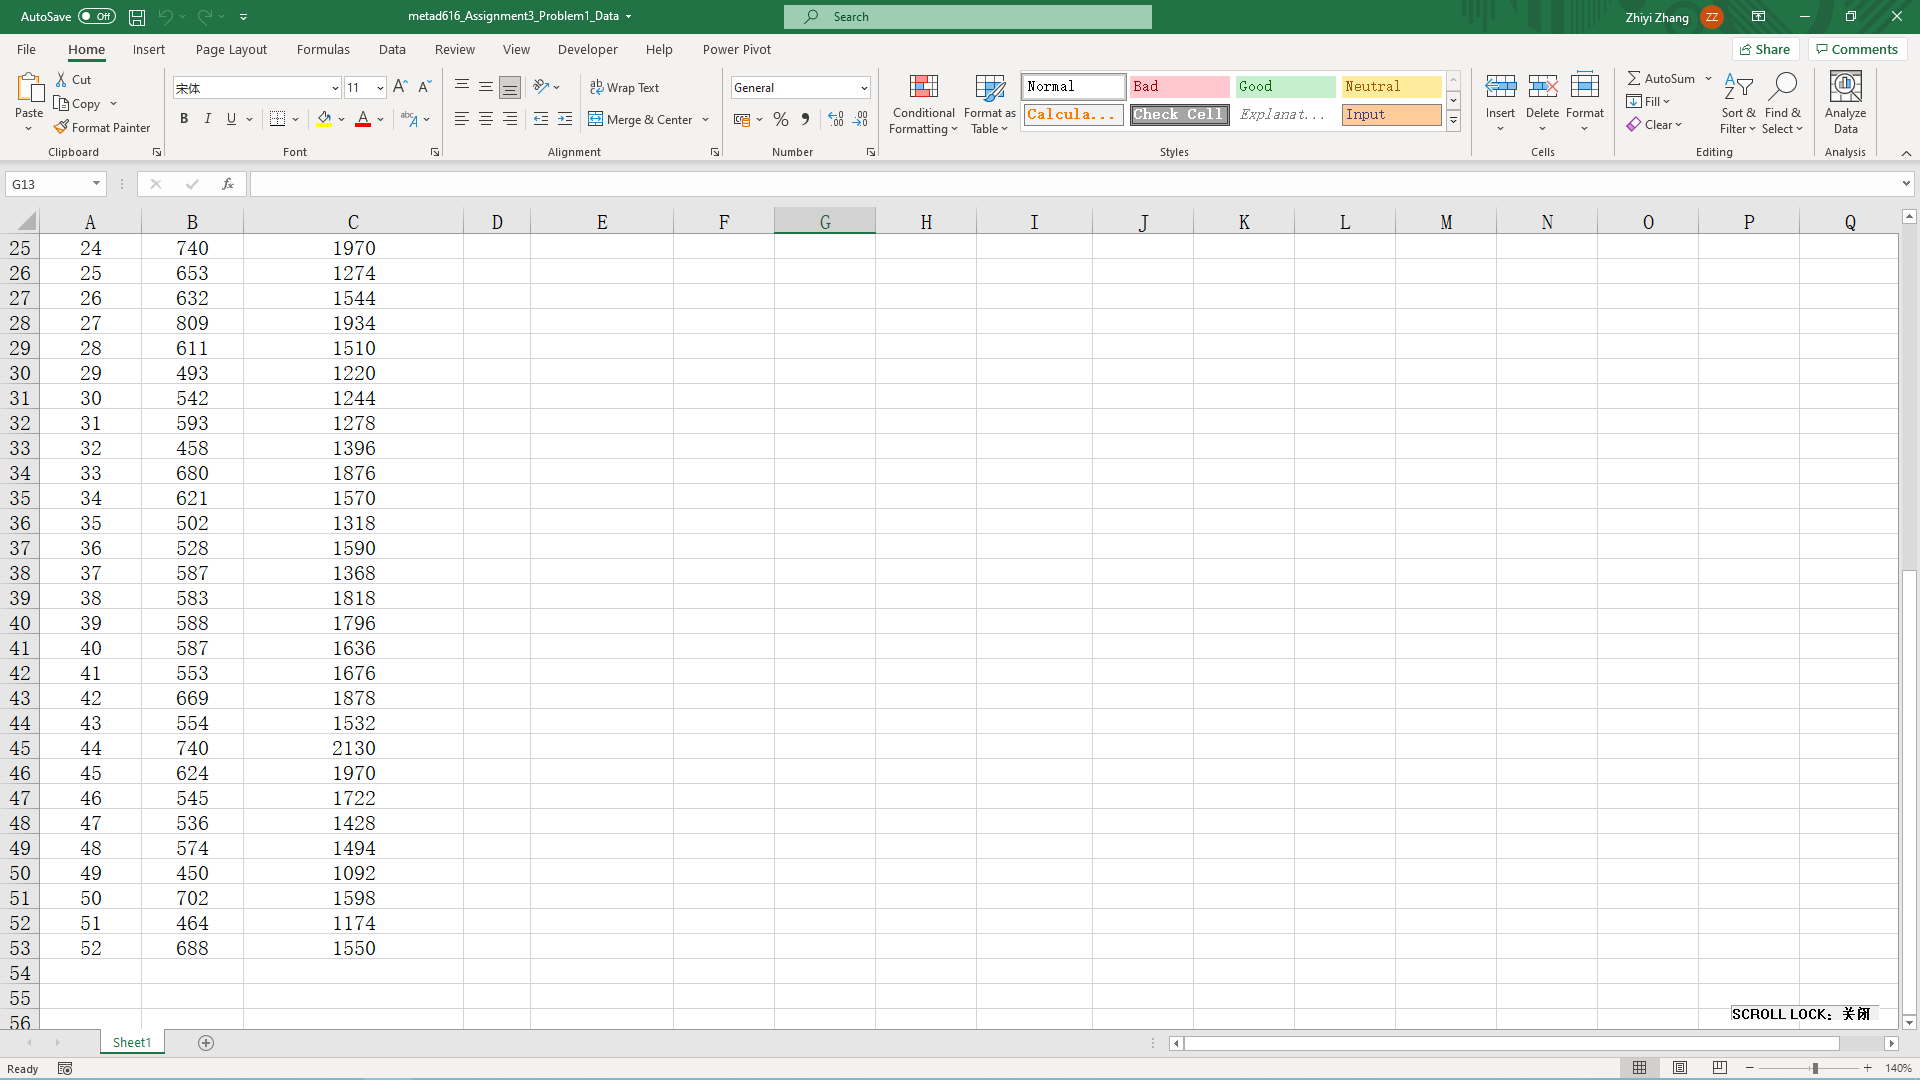
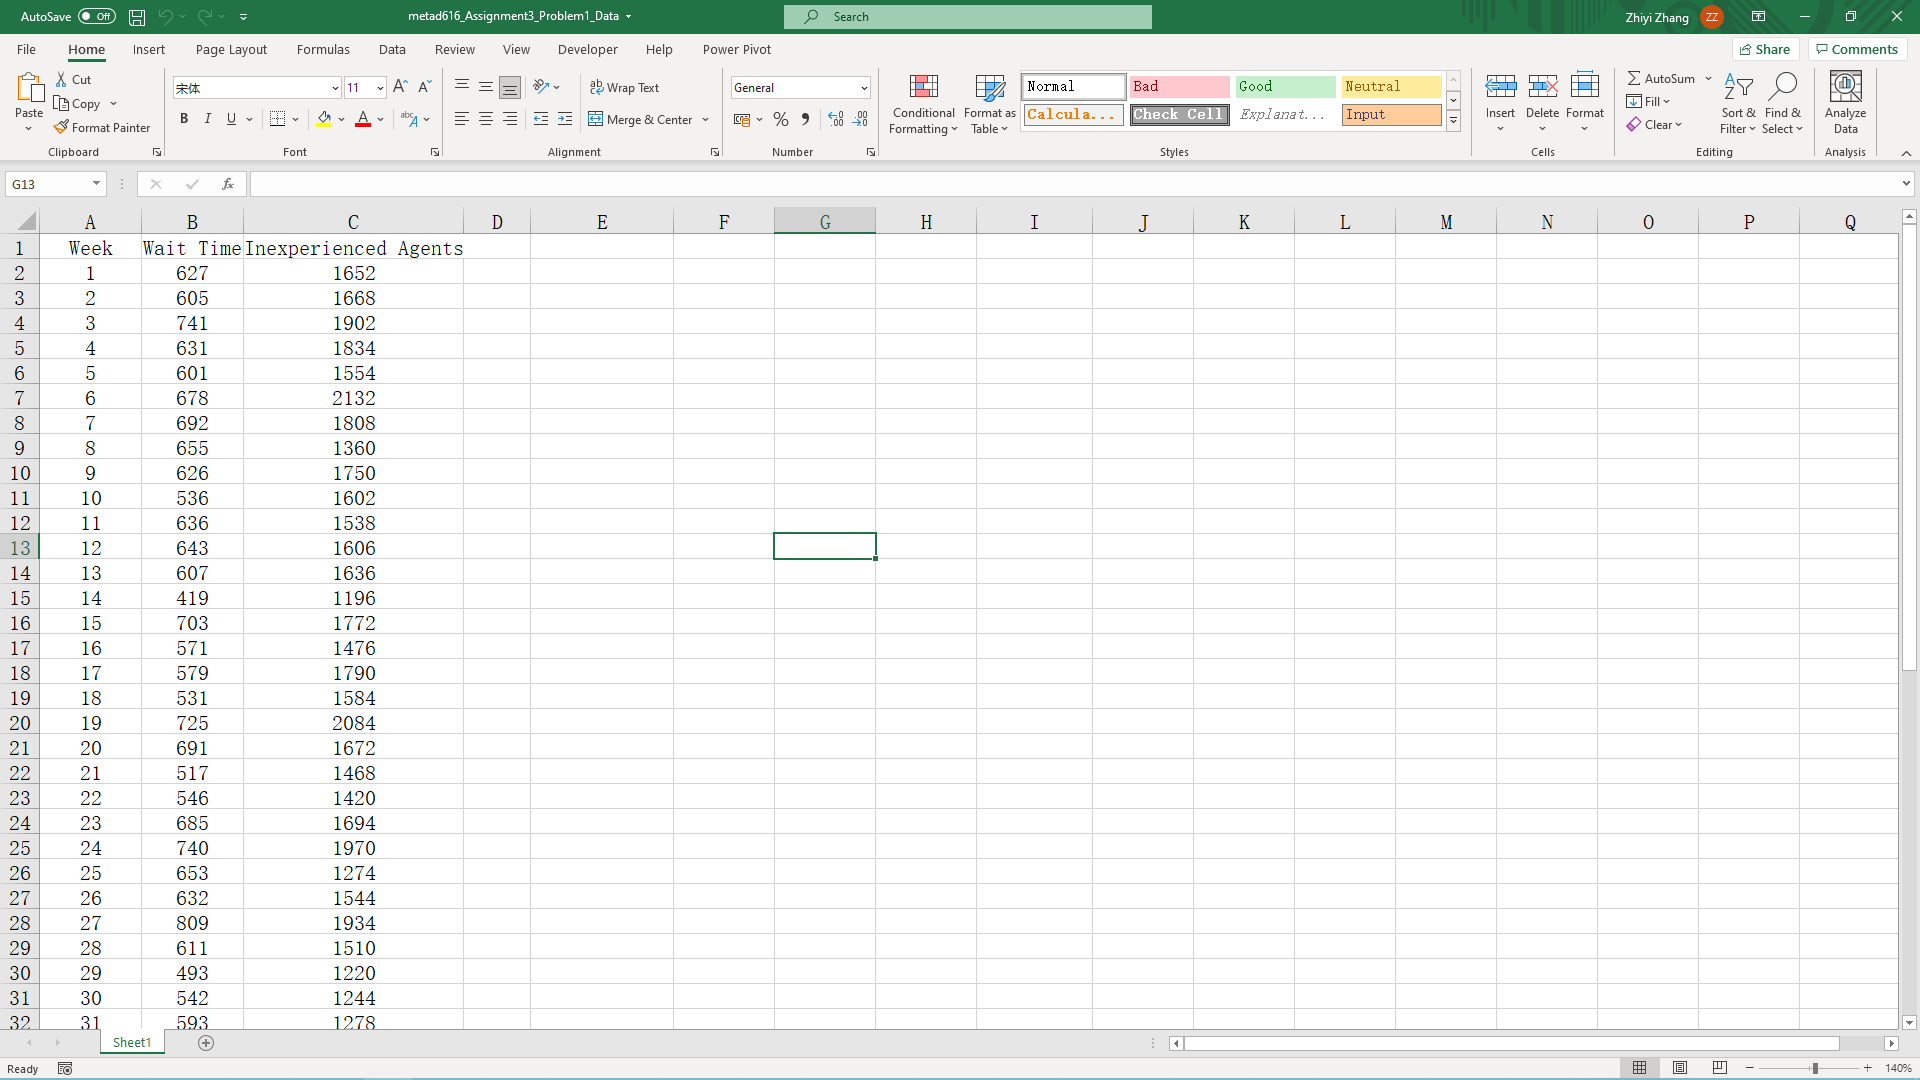
A call center is examining its data regarding the complaints of its callers. Two complaint areas are identified: customers who complain due to the wait time to talk to an agent, and customers who complain due to inexperienced agents. Each data set consists of number of complaints per week. The Excel file Assignment3_Problem1_Data includes the complaint data for the last year for these two categories.
a.What is the distribution of weekly complaints in each category? Identify the name of the distribution and its mean and standard deviation. Fit a continuous distribution to the data and use the K-S test as goodness-of-fit criteria.
b.Are the two categories of weekly complaints correlated to each other? If yes, describe their correlation.
Set up a simulation that calculates the total complaints by week. In your simulation, there will be two input variables - one for weekly complaints due to the wait time to talk to an agent and one for the weekly complaints due to inexperienced agents. Use the fitted distributions that you identified in (a). If there is a correlation between the complaint types, include it in your model. Using your simulation model, answer the following questions.
c.What is the mean and standard deviation of the total complaints by week?
d.What is the 95% confidence interval for the mean complaints by week? Interpret this interval.
e.What is the probability that the total complaints in a week will be less than 600?
f.What is the probability that the total complaints in a week will be bigger than 2600?
Now, re-run the simulation by ignoring the correlation among the complaint types and re-answer
questions (c)- (f) above. How would your answers to those questions change? What is the impact of
ignoring correlation in this setting?
Excel data:
Week, Wait Time, Inexperienced Agents
1 627 1652
2 605 1668
3 741 1902
4 631 1834
5 601 1554
6 678 2132
7 692 1808
8 655 1360
9 626 1750
10 536 1602
11 636 1538
12 643 1606
13 607 1636
14 419 1196
15 703 1772
16 571 1476
17 579 1790
18 531 1584
19 725 2084
20 691 1672
21 517 1468
22 546 1420
23 685 1694
24 740 1970
25 653 1274
26 632 1544
27 809 1934
28 611 1510
29 493 1220
30 542 1244
31 593 1278
32 458 1396
33 680 1876
34 621 1570
35 502 1318
36 528 1590
37 587 1368
38 583 1818
39 588 1796
40 587 1636
41 553 1676
42 669 1878
43 554 1532
44 740 2130
45 624 1970
46 545 1722
47 536 1428
48 574 1494
49 450 1092
50 702 1598
51 464 1174
52 688 1550
Zhiyi Zhang Z AutoSave . Off) H 9 metad616_Assignment3_Problem1_Data - Share Comments File Home Insert Page Layout Formulas Data Review View Developer Help Power Pivot 2 AutoSum ~ AY O & Cut 11 ~A A ae Wrap Text Genera Normal Bad Good Neutral Fill Input sent Delete Format Sort & Find & Analyze [G Copy = = = Merge & Center Conditional Format as Calcula. . - Check Cell Explanat. . . Paste E [ ~ % 9 00 20 Clear Table v Filter ~ Select Data Format Painter Formatting Cells Editing Analysis Alignment Number Styles Clipboard Font G13 X V C D E F G H I J K L M N 0 P Q A B 25 24 740 1970 26 25 653 1274 27 26 632 1544 28 27 809 1934 29 28 611 1510 30 29 493 1220 31 30 542 1244 32 31 593 1278 33 32 458 1396 34 33 680 1876 35 34 621 1570 36 35 502 1318 37 36 528 1590 38 37 587 1368 39 38 583 1818 40 39 588 1796 41 40 587 1636 42 41 553 1676 43 42 669 1878 44 43 554 153 45 44 740 2130 46 45 624 1970 47 46 545 1722 48 47 536 1428 49 48 574 1494 50 49 450 1092 51 50 702 1598 52 51 464 1174 53 52 688 1550 54 55 SCROLL LOCK: *PI 56 Sheet1 + ReadyAutoSave . Off) H 9 metad616_Assignment3_Problem1_Data - Zhiyi Zhang Z File Home Insert Page Layout Formulas Data Review View Developer Help Power Pivot Share Comments & Cut 2 AutoSum ~ 11 ~ A A ag Wrap Text Genera Normal Bad Good Neutral AY O Paste [G Copy Fill sent Delete Format Sort & Find & Analyze Format Painter BIU~ ~ ~ A abAv E = = E Merge & Center [ ~ % 9 00 20 Conditional Format as Calcula. . - Check Cell Explanat. . . Input Clear Formatting Table v Filter ~ Select Data Clipboard Font Alignment Number Styles Cells Editing Analysis G13 X V A B C D E F G H I J K L M N 0 P Q Week Wait Time Inexperienced Agents 1 627 1652 605 1668 741 1902 631 1834 601 1554 678 2132 7 692 1808 8 655 1360 10 626 1750 11 10 536 1602 11 636 1538 12 643 1606 13 607 1636 15 14 419 1196 16 15 703 1772 17 16 571 1476 18 17 579 1790 19 18 531 1584 20 19 725 2084 21 20 691 1672 22 21 517 1468 23 22 546 1420 24 23 685 1694 25 24 740 1970 26 25 653 1274 27 26 632 1544 28 27 809 1934 29 28 611 1510 30 29 493 1220 31 30 542 1244 32 31 593 1278 Sheet1 + Ready
Step by Step Solution
There are 3 Steps involved in it

Get step-by-step solutions from verified subject matter experts