

Question: please use R to do this problem step by step. There is a direction. please show me R results and R code. Thank you. 3.
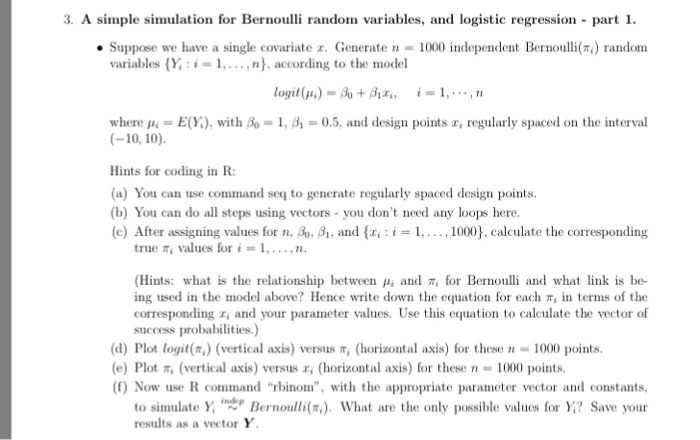
3. A simple simulation for Bernoulli random variables, and logistic regression part 1. Suppose we have a single covariate z. Generate n 1000 independent Bernoulli(TE) random variables (Y i 1,...,nt, according to the model logit Bo Biz, i 1,..., n (pi)- where H E(Y), with Ao 1, Bh 0.5, and design points ar regularly spaced on the interval (-10, 10) Hints for coding in R: (a) You can use command seq to generate regularly spaced design points. (b) You can do all steps using vectors you don't need any loops here. (c) After assigning values for n, Bo, and {ai i 1, 1000 calculate the corresponding true values for i 1,...,n (Hints: what is the relationship between pu and T for Bernoulli and what link is be- ing used in the model above? Hence write down the equation for each T, in terms of the corresponding ze and your parameter values. Use this equation to calculate the vector of success probabilities.) (d) Plot logit (vertical axis) versus ri horizontal axis) for these n- 1000 points (e) Plot T, (vertical axis) versus z (horizontal axis) for these n 1000 points. (f) Now use R command "rbinom", with the appropriate parameter vector and constants to simulate Y P Bernoulli(mi). What are the only possible values for Y? Save your results as a vector Y
Step by Step Solution
There are 3 Steps involved in it

Get step-by-step solutions from verified subject matter experts