

Question: PLEASE USE R TO GET THE ANSWER. AFTER YOU HAVE GOTTEN THE ANSWER PLEASE PROVIDE THE CODE, THE CODE IS THE MOST IMPORTANT PART, AND
PLEASE USE R TO GET THE ANSWER. AFTER YOU HAVE GOTTEN THE ANSWER PLEASE PROVIDE THE CODE, THE CODE IS THE MOST IMPORTANT PART, AND A FEW PICTURES OF THE GRAPHS THEMSELVES. AND PLEASE PROVIDE A SHORT SUMMARY OF WHAT THE GRAPH MEANS (2-3 SENTENCES).

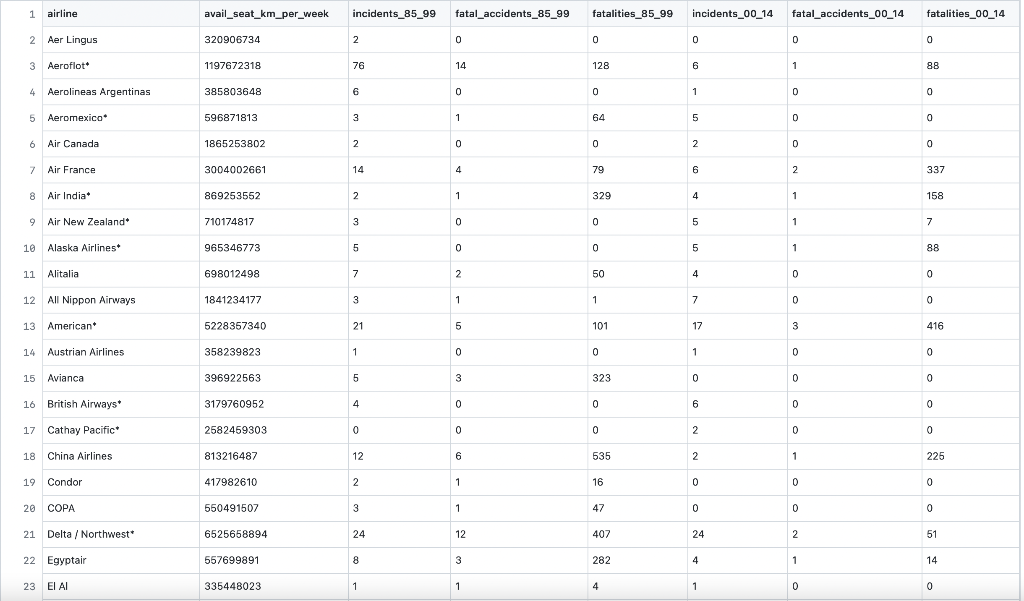
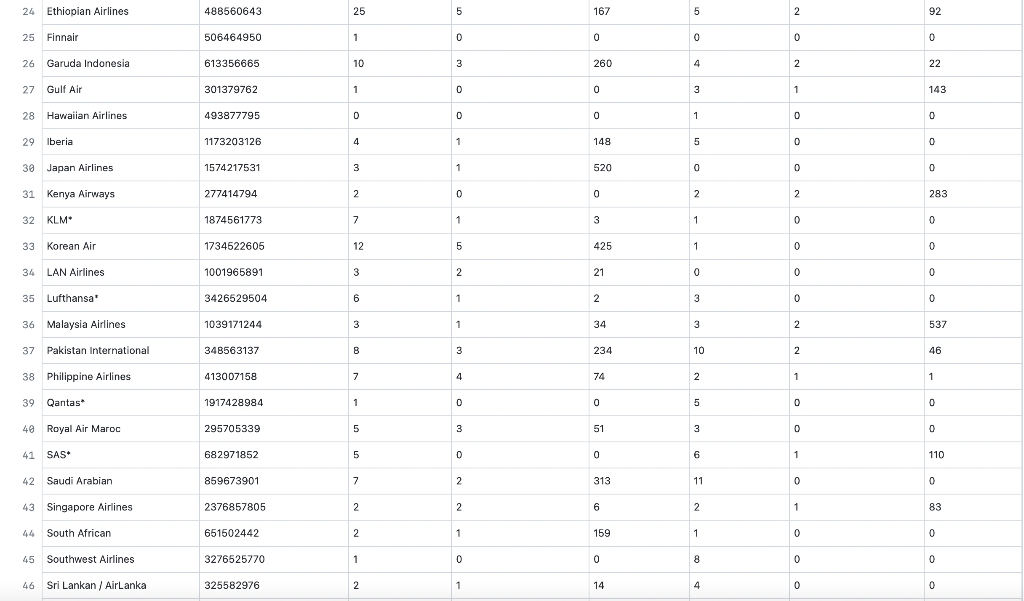
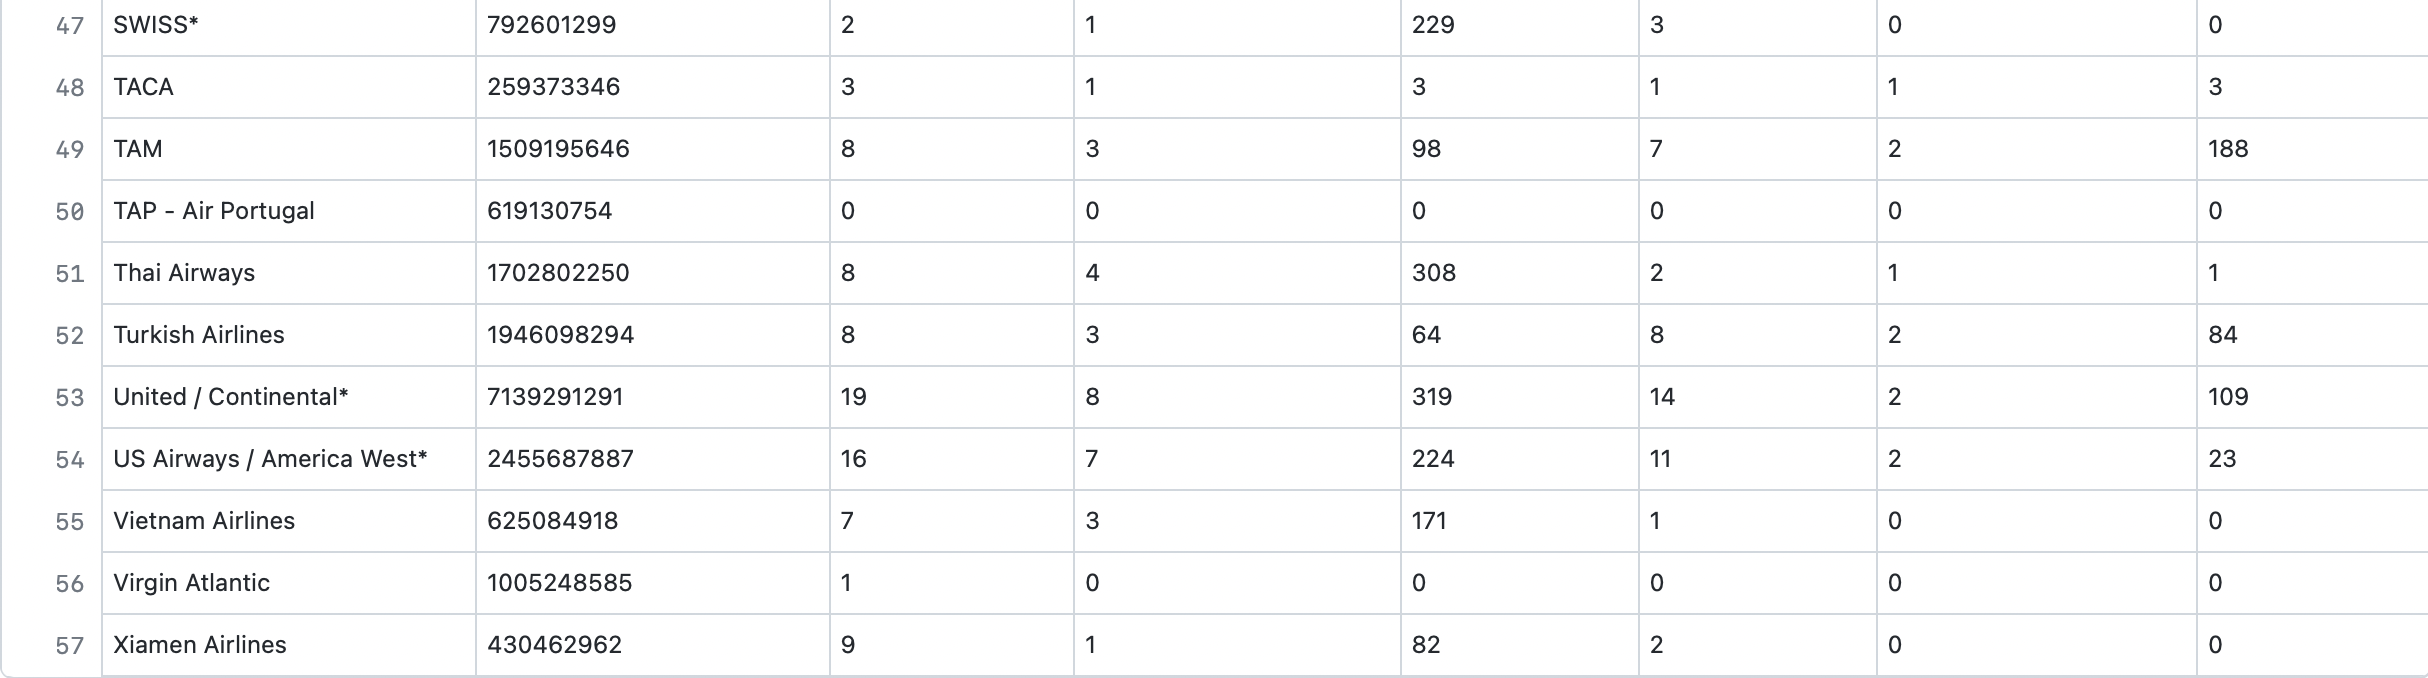
Project 2 Analyze Your Own Data Step 1 Select a Dataset For this project, you must find some sort of published, existing data. Possible sources include: almanacs, magazine and journal articles, textbooks, web resources, athletic teams, newspapers, reference materials, campus organizations, professors with experimental data, electronic data repositories, the sports pages. The dataset you select must have at least 25 cases. It also must have at least two categorical variables and at least two quantitative variables. It is very helpful to have a dataset that interests you. Step 2 Analyze Your Data! See the description below of what analysis should be included. Use technology as needed to automate calculations and graphs. Analysis of One Categorical Variable: For at least one of the categorical variables, include a fre- quency table and a relative frequency table, Analysis of One Relationship between Two Cat- egorical Variables: Include a two-way table and discuss any relevant proportions. Does there appear to be an association between the two variables? If so, describe it. Analysis of One Relationship between a Categor. ical Variable and a Quantitative Variable: Include a side-by-side plot and describe it. Does there appear to be an association between the two vari- ables? If so, describe it. Also, use some summary statistics to compare the groups Analysis of One Relationship between Two Quan. titative Variables: For at least one pair of quanti- tative variables, include a scatterplot and discuss it. Give the correlation and comment on the strength of linear association. Pick one of the variables to be a response variable, use the other as an explanatory variable, and fit a regression line. Interpret the slope of the regression line, Use the regression line to make at least one pre- diction for a point in the dataset and compute the residual. . Conclusion: Briefly summarize the most interest- ing features of your data. As you discuss each analysis, be sure to interpret what you are finding in the context of your particular data situation. Step 3 Write Your Report Include all of the following: Introduction: Give a reference for your data and describe all relevant variables. Include a copy of the dataset. Analysis of One Quantitative Variable: For at least one of the quantitative variables, include summary statistics (mean, standard deviation, five number summary) and at least one graphical display. Are there any outliers? Is the distribution symmetric, skewed, or some other shape? 1 airline avail_seat_km_per_week incidents_85_99 fatal accidents_85_99 fatalities_85_99 incidents_00_14 fatal_accidents_00_14 fatalities_00_14 2 Aer Lingus 320906734 2 2 0 O 0 0 0 0 0 3 Aeroflot 1197672318 76 14 128 6 1 88 4 Aerolineas Argentinas 385803648 6 0 0 1 0 0 5 Aeromexico 596871813 3 1 64 5 0 0 6 Air Canada 1865253802 2 0 0 2 0 0 0 7 Air France 3004002661 14 4 79 6 6 2 337 8 Air India 869253552 2 1 329 4 1 158 9 Air New Zealand 710174817 3 0 0 5 1 7 7 10 Alaska Airlines 965346773 5 0 0 5 1 88 11 Alitalia 698012498 7 2 50 4 0 0 12 All Nippon Airways 1841234177 3 1 1 7 0 0 0 13 American 5228357340 21 5 101 17 3 416 14 Austrian Airlines 358239823 1 0 0 0 1 0 0 0 15 Avianca 396922563 5 3 323 0 0 0 0 16 British Airways* 3179760952 4 0 0 6 0 0 17 Cathay Pacific 2582459303 0 0 0 0 2 0 0 18 China Airlines 813216487 12 6 6 535 2 2 1 225 19 Condor 417982610 2 1 16 0 0 0 20 COPA 550491507 3 1 47 0 0 0 0 0 21 Delta / Northwest 6525658894 24 12 407 24 2 51 22 Egyptair 557699891 8 3 282 4 1 14 23 EI AI 335448023 1 1 4 1 0 0 24 Ethiopian Airlines 488560643 25 5 167 5 2 2 92 25 Finnair 506464950 1 0 0 0 0 0 26 Garuda Indonesia 613356665 10 3 3 260 4 2 22 27 Gulf Air 301379762 1 1 0 0 0 0 3 1 1 143 28 Hawaiian Airlines 493877795 0 0 0 1 1 0 0 29 Iberia 1173203126 4 1 148 5 0 0 0 30 Japan Airlines 1574217531 3 1 520 0 0 0 31 Kenya Airways 277414794 2 2 0 0 0 2 2 2 283 32 KLM 1874561773 7 1 3 1 0 0 33 Korean Air 1734522605 12 5 425 1 0 0 34 LAN Airlines 1001965891 3 3 2 21 0 0 0 0 0 0 35 Lufthansa 3426529504 6 1 2 3 0 0 1039171244 3 1 34 3 2 537 36 Malaysia Airlines 37 Pakistan International 348563137 8 3 234 10 2 46 38 Philippine Airlines 413007158 7 4 4 74 2 1 1 39 Qantas 1917428984 1 0 0 0 5 0 0 40 Royal Air Maroc 295705339 5 3 51 3 0 0 41 SAS 682971852 5 0 0 0 6 1 110 42 Saudi Arabian 859673901 7 2 313 11 0 0 43 Singapore Airlines 2376857805 2 2 6 6 2 1 83 South African 651502442 2 1 159 1 0 0 45 Southwest Airlines 3276525770 1 0 0 8 0 0 46 Sri Lankan / AirLanka 325582976 2 1 14 4 0 0 0 47 SWISS* 792601299 2 1 229 3 O 0 48 TACA 259373346 3 1 3 1 1 3 49 TAM 1509195646 00 8 3 98 7 2 188 50 TAP - Air Portugal 619130754 0 O o O 0 0 51 Thai Airways 1702802250 8 4 308 2 1 1 52 Turkish Airlines 1946098294 8 3 64 8 2 84 53 United / Continental* 7139291291 19 8 319 14 2 109 00 N 54 US Airways America West* 2455687887 16 7 224 11 2 23 55 Vietnam Airlines 625084918 7 3 171 1 o o 56 Virgin Atlantic 1005248585 1 o o 0 0 o o 57 Xiamen Airlines 430462962 9 1 82 2 0 0 Project 2 Analyze Your Own Data Step 1 Select a Dataset For this project, you must find some sort of published, existing data. Possible sources include: almanacs, magazine and journal articles, textbooks, web resources, athletic teams, newspapers, reference materials, campus organizations, professors with experimental data, electronic data repositories, the sports pages. The dataset you select must have at least 25 cases. It also must have at least two categorical variables and at least two quantitative variables. It is very helpful to have a dataset that interests you. Step 2 Analyze Your Data! See the description below of what analysis should be included. Use technology as needed to automate calculations and graphs. Analysis of One Categorical Variable: For at least one of the categorical variables, include a fre- quency table and a relative frequency table, Analysis of One Relationship between Two Cat- egorical Variables: Include a two-way table and discuss any relevant proportions. Does there appear to be an association between the two variables? If so, describe it. Analysis of One Relationship between a Categor. ical Variable and a Quantitative Variable: Include a side-by-side plot and describe it. Does there appear to be an association between the two vari- ables? If so, describe it. Also, use some summary statistics to compare the groups Analysis of One Relationship between Two Quan. titative Variables: For at least one pair of quanti- tative variables, include a scatterplot and discuss it. Give the correlation and comment on the strength of linear association. Pick one of the variables to be a response variable, use the other as an explanatory variable, and fit a regression line. Interpret the slope of the regression line, Use the regression line to make at least one pre- diction for a point in the dataset and compute the residual. . Conclusion: Briefly summarize the most interest- ing features of your data. As you discuss each analysis, be sure to interpret what you are finding in the context of your particular data situation. Step 3 Write Your Report Include all of the following: Introduction: Give a reference for your data and describe all relevant variables. Include a copy of the dataset. Analysis of One Quantitative Variable: For at least one of the quantitative variables, include summary statistics (mean, standard deviation, five number summary) and at least one graphical display. Are there any outliers? Is the distribution symmetric, skewed, or some other shape? 1 airline avail_seat_km_per_week incidents_85_99 fatal accidents_85_99 fatalities_85_99 incidents_00_14 fatal_accidents_00_14 fatalities_00_14 2 Aer Lingus 320906734 2 2 0 O 0 0 0 0 0 3 Aeroflot 1197672318 76 14 128 6 1 88 4 Aerolineas Argentinas 385803648 6 0 0 1 0 0 5 Aeromexico 596871813 3 1 64 5 0 0 6 Air Canada 1865253802 2 0 0 2 0 0 0 7 Air France 3004002661 14 4 79 6 6 2 337 8 Air India 869253552 2 1 329 4 1 158 9 Air New Zealand 710174817 3 0 0 5 1 7 7 10 Alaska Airlines 965346773 5 0 0 5 1 88 11 Alitalia 698012498 7 2 50 4 0 0 12 All Nippon Airways 1841234177 3 1 1 7 0 0 0 13 American 5228357340 21 5 101 17 3 416 14 Austrian Airlines 358239823 1 0 0 0 1 0 0 0 15 Avianca 396922563 5 3 323 0 0 0 0 16 British Airways* 3179760952 4 0 0 6 0 0 17 Cathay Pacific 2582459303 0 0 0 0 2 0 0 18 China Airlines 813216487 12 6 6 535 2 2 1 225 19 Condor 417982610 2 1 16 0 0 0 20 COPA 550491507 3 1 47 0 0 0 0 0 21 Delta / Northwest 6525658894 24 12 407 24 2 51 22 Egyptair 557699891 8 3 282 4 1 14 23 EI AI 335448023 1 1 4 1 0 0 24 Ethiopian Airlines 488560643 25 5 167 5 2 2 92 25 Finnair 506464950 1 0 0 0 0 0 26 Garuda Indonesia 613356665 10 3 3 260 4 2 22 27 Gulf Air 301379762 1 1 0 0 0 0 3 1 1 143 28 Hawaiian Airlines 493877795 0 0 0 1 1 0 0 29 Iberia 1173203126 4 1 148 5 0 0 0 30 Japan Airlines 1574217531 3 1 520 0 0 0 31 Kenya Airways 277414794 2 2 0 0 0 2 2 2 283 32 KLM 1874561773 7 1 3 1 0 0 33 Korean Air 1734522605 12 5 425 1 0 0 34 LAN Airlines 1001965891 3 3 2 21 0 0 0 0 0 0 35 Lufthansa 3426529504 6 1 2 3 0 0 1039171244 3 1 34 3 2 537 36 Malaysia Airlines 37 Pakistan International 348563137 8 3 234 10 2 46 38 Philippine Airlines 413007158 7 4 4 74 2 1 1 39 Qantas 1917428984 1 0 0 0 5 0 0 40 Royal Air Maroc 295705339 5 3 51 3 0 0 41 SAS 682971852 5 0 0 0 6 1 110 42 Saudi Arabian 859673901 7 2 313 11 0 0 43 Singapore Airlines 2376857805 2 2 6 6 2 1 83 South African 651502442 2 1 159 1 0 0 45 Southwest Airlines 3276525770 1 0 0 8 0 0 46 Sri Lankan / AirLanka 325582976 2 1 14 4 0 0 0 47 SWISS* 792601299 2 1 229 3 O 0 48 TACA 259373346 3 1 3 1 1 3 49 TAM 1509195646 00 8 3 98 7 2 188 50 TAP - Air Portugal 619130754 0 O o O 0 0 51 Thai Airways 1702802250 8 4 308 2 1 1 52 Turkish Airlines 1946098294 8 3 64 8 2 84 53 United / Continental* 7139291291 19 8 319 14 2 109 00 N 54 US Airways America West* 2455687887 16 7 224 11 2 23 55 Vietnam Airlines 625084918 7 3 171 1 o o 56 Virgin Atlantic 1005248585 1 o o 0 0 o o 57 Xiamen Airlines 430462962 9 1 82 2 0 0
Step by Step Solution
There are 3 Steps involved in it

Get step-by-step solutions from verified subject matter experts