

Question: Please use RStudio and explain each step 1 . In the following you are going to analyze the Caschool ( The California Test Score )
Please use RStudio and explain each step
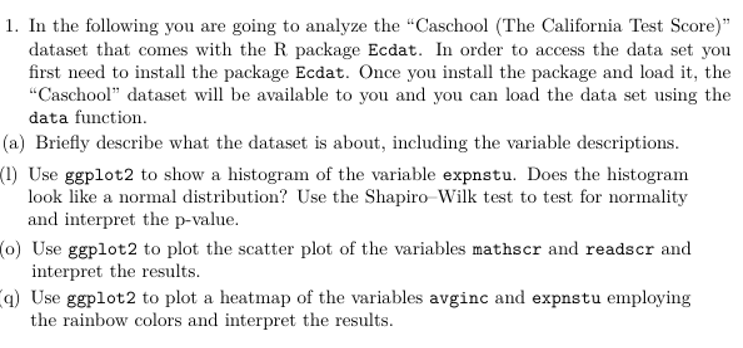
In the following you are going to analyze the "Caschool The California Test Score dataset that comes with the R package Ecdat. In order to access the data set you first need to install the package Ecdat. Once you install the package and load it the "Caschool" dataset will be available to you and you can load the data set using the data function.
a Briefly describe what the dataset is about, including the variable descriptions.
Use ggplot to show a histogram of the variable expnstu. Does the histogram look like a normal distribution? Use the ShapiroWilk test to test for normality and interpret the pvalue.
o Use ggplot to plot the scatter plot of the variables mathscr and readscr and interpret the results.
q Use ggplot to plot a heatmap of the variables avginc and expnstu employing the rainbow colors and interpret the results.
Step by Step Solution
There are 3 Steps involved in it
1 Expert Approved Answer
Step: 1 Unlock

Question Has Been Solved by an Expert!
Get step-by-step solutions from verified subject matter experts
Step: 2 Unlock
Step: 3 Unlock