

Question: PLEASE USE RSTUDIO The pancakes.csv dataset is: 3. Two-Way ANOVA Question 2 The data for this question is contained in the comma-separated value file pancake.csv,
PLEASE USE RSTUDIO
The pancakes.csv dataset is:
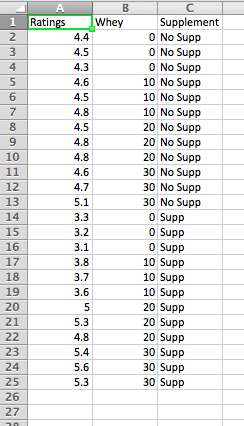
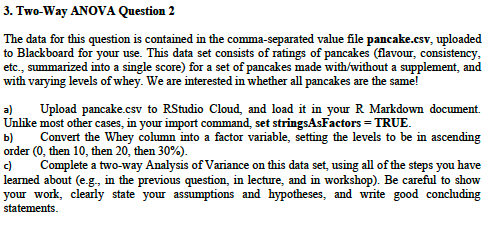
3. Two-Way ANOVA Question 2 The data for this question is contained in the comma-separated value file pancake.csv, uploaded to Blackboard for your use. This data set consists of ratings of pancakes (flavour, consistency, etc., summarized into a single score) for a set of pancakes made with/without a supplement, and with varying levels of whey. We are interested in whether all pancakes are the same! a) Upload pancake.csv to RStudio Cloud, and load it in your R Markdown document. Unlike most other cases, in your import command, set stringsAsFactors = TRUE. b) Convert the Whey column into a factor variable, setting the levels to be in ascending order (0, then 10, then 20, then 30%). c) Complete a two-way Analysis of Variance on this data set, using all of the steps you have learned about (e.g., in the previous question, in lecture, and in workshop). Be careful to show your work, clearly state your assumptions and hypotheses, and write good concluding statements. A Ratings 1 2 3 4 5 6 7 8 9 10 11 12 13 14 15 16 17 18 19 20 21 22 23 24 25 26 27 B Whey 4.4 4.5 4.3 4.6 4.5 4.8 4.5 4.8 4.8 4.6 4.7 5.1 3.3 3.2 3.1 3.8 3.7 3.6 Supplement 0 No Supp O No Supp o No Supp 10 No Supp 10 No Supp 10 No Supp 20 No Supp 20 No Supp 20 No Supp 30 No Supp 30 No Supp 30 No Supp O Supp O Supp O Supp 10 Supp 10 Supp 10 Supp 20 Supp 20 Supp 20 Supp 30 Supp 30 Supp 30 Supp 5.3 4.8 5.4 5.6 5.3 3. Two-Way ANOVA Question 2 The data for this question is contained in the comma-separated value file pancake.csv, uploaded to Blackboard for your use. This data set consists of ratings of pancakes (flavour, consistency, etc., summarized into a single score) for a set of pancakes made with/without a supplement, and with varying levels of whey. We are interested in whether all pancakes are the same! a) Upload pancake.csv to RStudio Cloud, and load it in your R Markdown document. Unlike most other cases, in your import command, set stringsAsFactors = TRUE. b) Convert the Whey column into a factor variable, setting the levels to be in ascending order (0, then 10, then 20, then 30%). c) Complete a two-way Analysis of Variance on this data set, using all of the steps you have learned about (e.g., in the previous question, in lecture, and in workshop). Be careful to show your work, clearly state your assumptions and hypotheses, and write good concluding statements. A Ratings 1 2 3 4 5 6 7 8 9 10 11 12 13 14 15 16 17 18 19 20 21 22 23 24 25 26 27 B Whey 4.4 4.5 4.3 4.6 4.5 4.8 4.5 4.8 4.8 4.6 4.7 5.1 3.3 3.2 3.1 3.8 3.7 3.6 Supplement 0 No Supp O No Supp o No Supp 10 No Supp 10 No Supp 10 No Supp 20 No Supp 20 No Supp 20 No Supp 30 No Supp 30 No Supp 30 No Supp O Supp O Supp O Supp 10 Supp 10 Supp 10 Supp 20 Supp 20 Supp 20 Supp 30 Supp 30 Supp 30 Supp 5.3 4.8 5.4 5.6 5.3
Step by Step Solution
There are 3 Steps involved in it

Get step-by-step solutions from verified subject matter experts