

Question: please use same same formatting. thank you so much! Data table Budgeted sales in units... Budgeted average selling price per unit Variable Cost of Goods

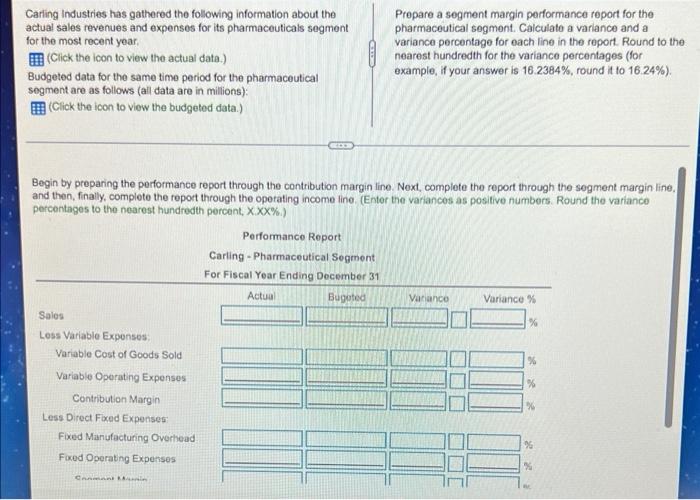
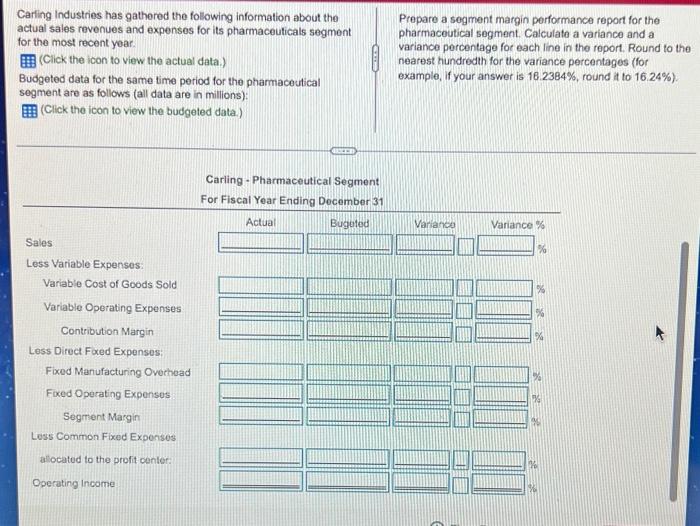
Data table Budgeted sales in units... Budgeted average selling price per unit Variable Cost of Goods Sold per unit Variable Operating Expenses per unit. $ $ Direct Fixed Manufacturing Overhead (in total) S Direct Fixed Operating Expenses (in total).. $ Common Fixed Expenses Allocated to the Pharmaceutical Segment S Print Done I X 8,900 150 35 30 107,000 21,000 25,000 Data table Salos. $1,602,000 S 336,420 **** Variable Cost of Goods Sold Variable Operating Expenses $ 258,990 108,070 Direct Fixed Manufacturing Overhead..... S Direct Fixed Operating Expenses. $ 23.100 Common Fixed Expenses S 27,500 Print Done Carling Industries has gathered the following information about the actual sales revenues and expenses for its pharmaceuticals segment for the most recent year. Prepare a segment margin performance report for the pharmaceutical segment. Calculate a variance and a variance percentage for each line in the report. Round to the nearest hundredth for the variance percentages (for example, if your answer is 16.2384 %, round it to 16.24%). (Click the icon to view the actual data.) Budgeted data for the same time period for the pharmaceutical segment are as follows (all data are in millions): (Click the icon to view the budgeted data.) Begin by preparing the performance report through the contribution margin line. Next, complete the report through the segment margin line, and then, finally, complete the report through the operating income line. (Enter the variances as positive numbers. Round the variance percentages to the nearest hundredth percent, X.XX%.) Performance Report Carling-Pharmaceutical Segment For Fiscal Year Ending December 31 Actual Bugeted Variance Variance % Sales % Loss Variable Expenses: % % % Variable Cost of Goods Sold Variable Operating Expenses Contribution Margin Less Direct Fixed Expenses Fixed Manufacturing Overhead Fixed Operating Expenses Conmant Min % % Carling Industries has gathered the following information about the actual sales revenues and expenses for its pharmaceuticals segment for the most recent year. (Click the icon to view the actual data.) Budgeted data for the same time period for the pharmaceutical segment are as follows (all data are in millions): (Click the icon to view the budgeted data.) Sales Less Variable Expenses: Variable Cost of Goods Sold Variable Operating Expenses Contribution Margin Less Direct Fixed Expenses: Fixed Manufacturing Overhead Fixed Operating Expenses Segment Margin Less Common Fixed Expenses allocated to the profit center: Operating Income RICER Carling - Pharmaceutical Segment For Fiscal Year Ending December 31 Actual Bugeted Prepare a segment margin performance report for the pharmaceutical segment. Calculate a variance and a variance percentage for each line in the report. Round to the nearest hundredth for the variance percentages (for example, if your answer is 16.2384 %, round it to 16.24%). Variance Variance % %
Step by Step Solution
There are 3 Steps involved in it

Get step-by-step solutions from verified subject matter experts