

Question: Use sample data provided in the following table to answer questions on this assessment. Unless required otherwise, round answers to three places after the decimal
Use sample data provided in the following table to answer questions on this assessment. Unless required otherwise, round answers to three places after the decimal point, and assume that all hypothesis tests are two-tailed and based on 0.05 level of significance. For between-group mean comparisons, assume equal variances across groups. After entering the data into the computer, verify that there was no data entry error by computing sample mean and sample standard deviation of each variable in your worksheet. These should be identical to statistics provided in the last two rows of the data table.
1a)
[Use data from problem 1] Test the hypothesis that the mean value of Weight1 is the same for Managers and Supervisors in the population. The p-value for this test is ______.
0.242 | ||
0.484 | ||
0.714 | ||
0.428 |
1b)
[Use data from problem 1] Test the hypothesis that the mean values of Rating1 and Rating2 are equal for Managers in the population. This test has ______ degrees of freedom.
11 | ||
12 | ||
29 | ||
30 |
1c)
[Use data from problem 1] Test the hypothesis that the mean values of Rating1 and Rating2 are equal for Supervisors in the population. At 5% level of significance the conclusion of this test is __________.
Fail to reject H0 and conclude that the mean value of Rating2 differs from mean value of Rating2 in the population. | ||
Reject H0 and conclude that the mean value of Rating2 differs from mean value of Rating2 in the population. | ||
Fail to reject H0 and conclude that the mean value of Rating2 equals mean value of Rating2 in the population. | ||
Reject H0 and conclude that the mean value of Rating2 equals mean value of Rating2 in the population. |
1d)
A professor claims that the average grade of students in her courses is 80%. Identify Type II error for this claim.
Fail to reject the claim that average grade is 80% when it is actually different from 80%. | ||
Reject the claim that average grade is 80% when it is actually 80%. | ||
Fail to reject the claim that average grade is 80% when it is actually 80%. | ||
Reject the claim that average grade is 80% when it is actually different from 80%. |
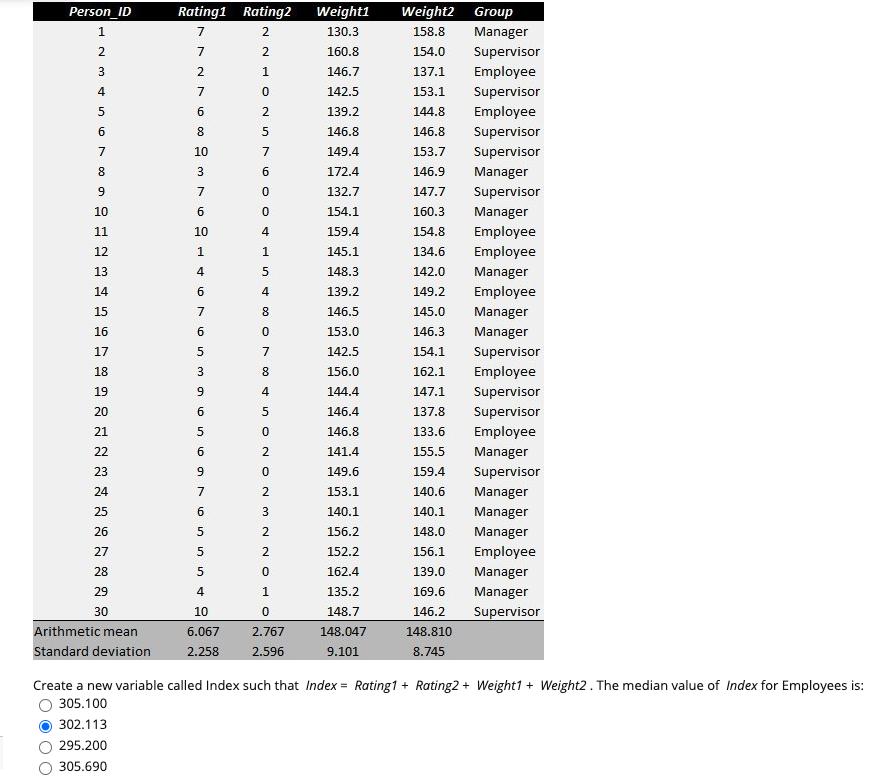
Person_ID 1 S A WNA 2 3 4 5 6780 9 10 11 12 13 w 14 15 16 17 18 222222222 19 20 21 23 24 25 26 27 28 29 30 Arithmetic mean Standard deviation Rating1 Rating2 2 77276 009 8 10 ma 3 7 169 10 1 4 5769 5 man 6 5 5 5 3 9 6 5 9 7 6 4 10 6.067 2.258 2 N 1 0 2 57 6 0 0 st 4 15 st 4 8 0 7 8 4 5 0 2 ON 2 3 2 2 0 1 0 2.767 2.596 Weight1 130.3 160.8 146.7 142.5 139.2 146.8 149.4 172.4 132.7 154.1 159.4 145.1 148.3 139.2 146.5 153.0 142.5 156.0 144.4 146.4 146.8 141.4 149.6 153.1 140.1 156.2 152.2 162.4 135.2 148.7 148.047 9.101 Weight2 Group 158.8 154.0 137.1 153.1 144.8 146.8 153.7 146.9 147.7 160.3 154.8 134.6 142.0 Manager Supervisor Employee Supervisor Employee Supervisor Supervisor Manager Supervisor Manager Employee Employee Manager 149.2 Employee 145.0 Manager 146.3 Manager 154.1 Supervisor 162.1 Employee 147.1 Supervisor 137.8 Supervisor 133.6 Employee 155.5 Manager 159.4 Supervisor 140.6 Manager 140.1 Manager 148.0 Manager 156.1 Employee 139.0 Manager 169.6 Manager 146.2 Supervisor 148.810 8.745 Create a new variable called Index such that Index = Rating1+ Rating2+ Weight1+ Weight2. The median value of Index for Employees is: 305.100 302.113 295.200 305.690
Step by Step Solution
3.55 Rating (173 Votes )
There are 3 Steps involved in it
Solution 1b 19 Given data XR2 2767 SR2 2596 n 30 Test stat... View full answer

Get step-by-step solutions from verified subject matter experts