

Question: please use SAS studios and answer the questions please i am so lost! SAS book 12-1 Conduct a Logistic regression for odds of death as

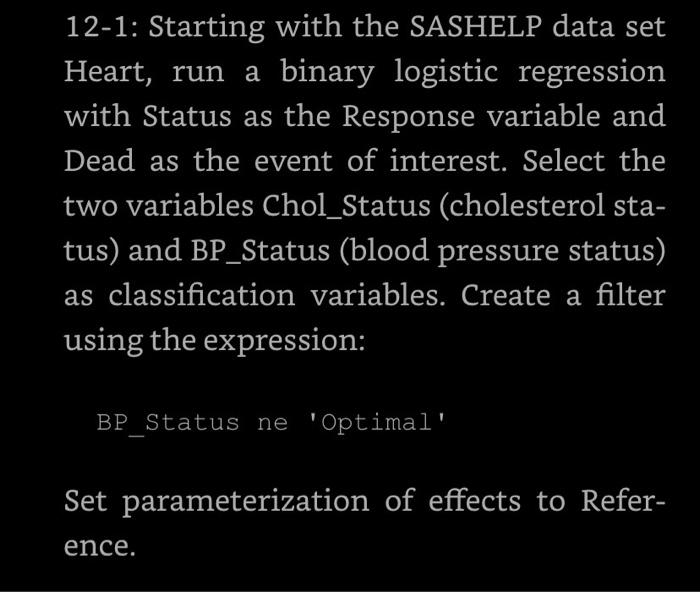

SAS book 12-1 Conduct a Logistic regression for odds of death as a function of Chol Status and BP status. Filter data as recommended. State the research question in the form of an hypothesis. Provide table of parameter estimates and odds ratios both with 95% confidence intervals. Are both variables significantly related to Odds of death? Interpret you results in a few sentences. 12-1: Starting with the SASHELP data set Heart, run a binary logistic regression with Status as the Response variable and Dead as the event of interest. Select the two variables Chol_Status (cholesterol sta- tus) and BP_Status (blood pressure status) as classification variables. Create a filter using the expression: BP_Status ne 'Optimal' Set parameterization of effects to Refer- ence. Using SASHELP.BMT generate survival graph comparing the survival curves for each disease groups. State the research question in the form of a hypothesis. Conduct log-rank test to determine if the survivor times are , statistically different between the groups. Interpret you results in a few sentences. 1209 133 words { Focus S T SAS book 12-1 Conduct a Logistic regression for odds of death as a function of Chol Status and BP status. Filter data as recommended. State the research question in the form of an hypothesis. Provide table of parameter estimates and odds ratios both with 95% confidence intervals. Are both variables significantly related to Odds of death? Interpret you results in a few sentences. 12-1: Starting with the SASHELP data set Heart, run a binary logistic regression with Status as the Response variable and Dead as the event of interest. Select the two variables Chol_Status (cholesterol sta- tus) and BP_Status (blood pressure status) as classification variables. Create a filter using the expression: BP_Status ne 'Optimal' Set parameterization of effects to Refer- ence. Using SASHELP.BMT generate survival graph comparing the survival curves for each disease groups. State the research question in the form of a hypothesis. Conduct log-rank test to determine if the survivor times are , statistically different between the groups. Interpret you results in a few sentences. 1209 133 words { Focus S T
Step by Step Solution
There are 3 Steps involved in it

Get step-by-step solutions from verified subject matter experts