

Question: Please use the above data (common size balance sheet, common size income statement, cash flow identity, asset utilization metrics, profitability, liquidity metrics, leverage metrics, working
Please use the above data (common size balance sheet, common size income statement, cash flow identity, asset utilization metrics, profitability, liquidity metrics, leverage metrics, working capital amount) and write up a one or two page discussing analyzing your results.
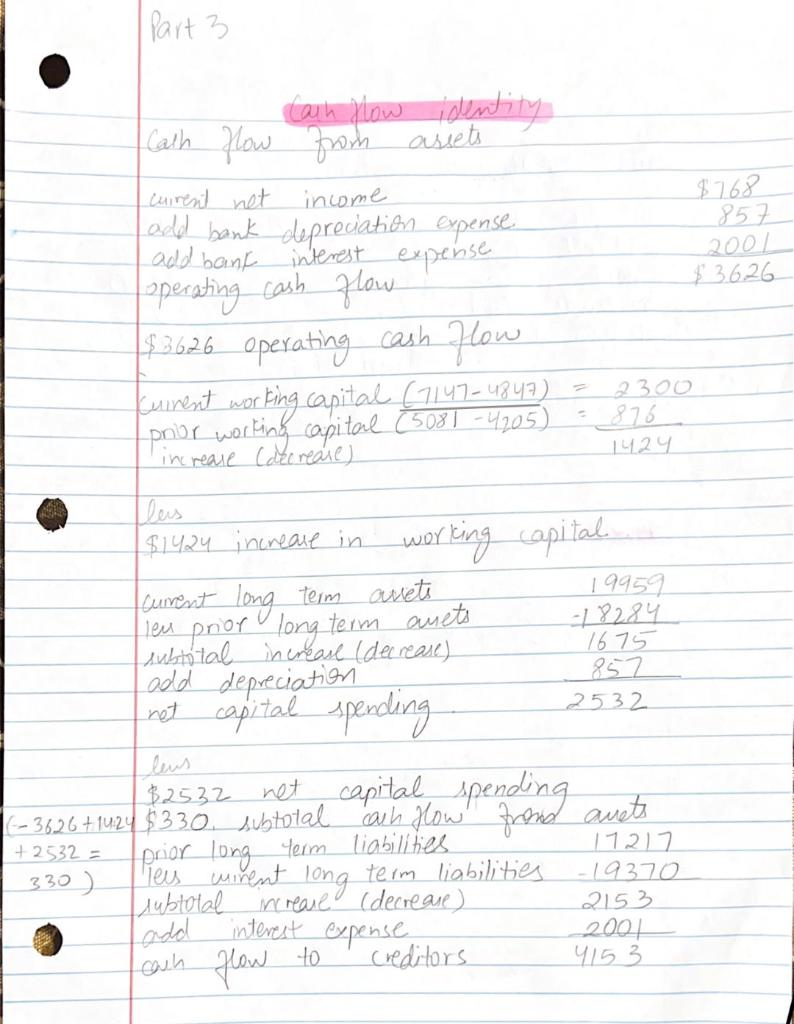
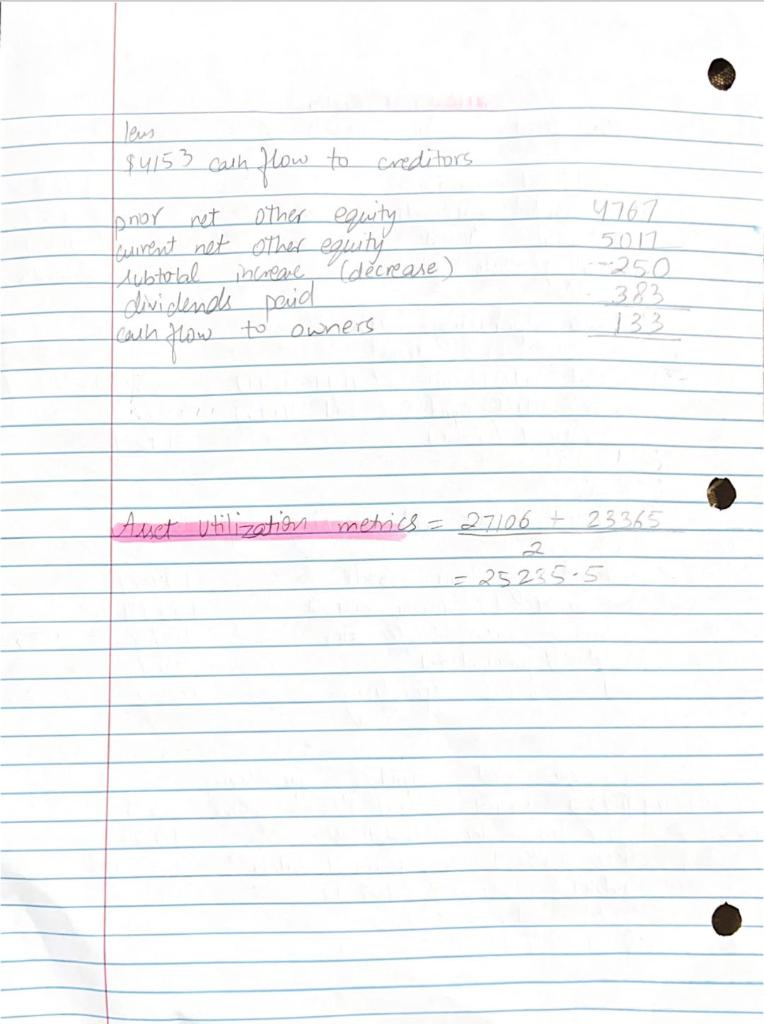
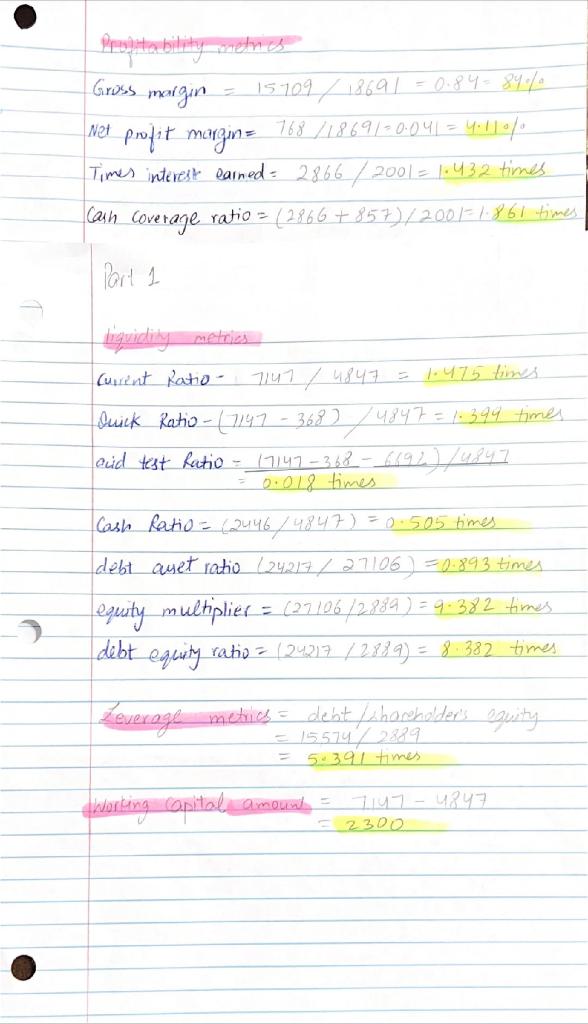
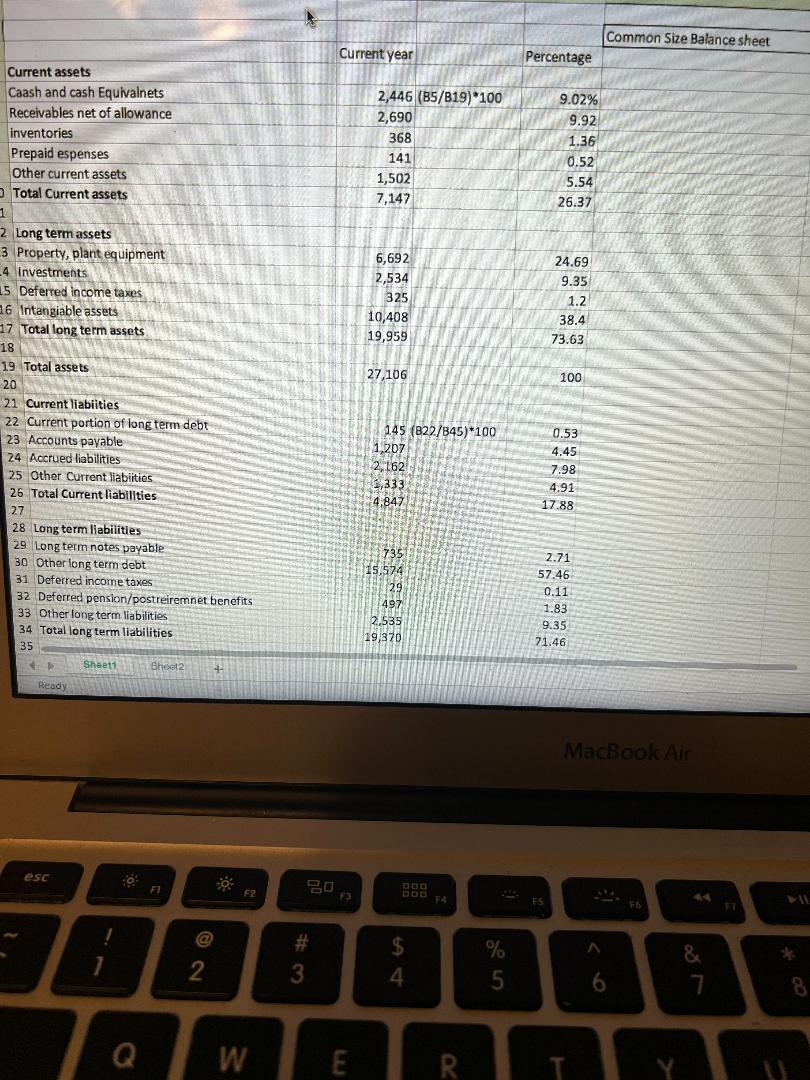
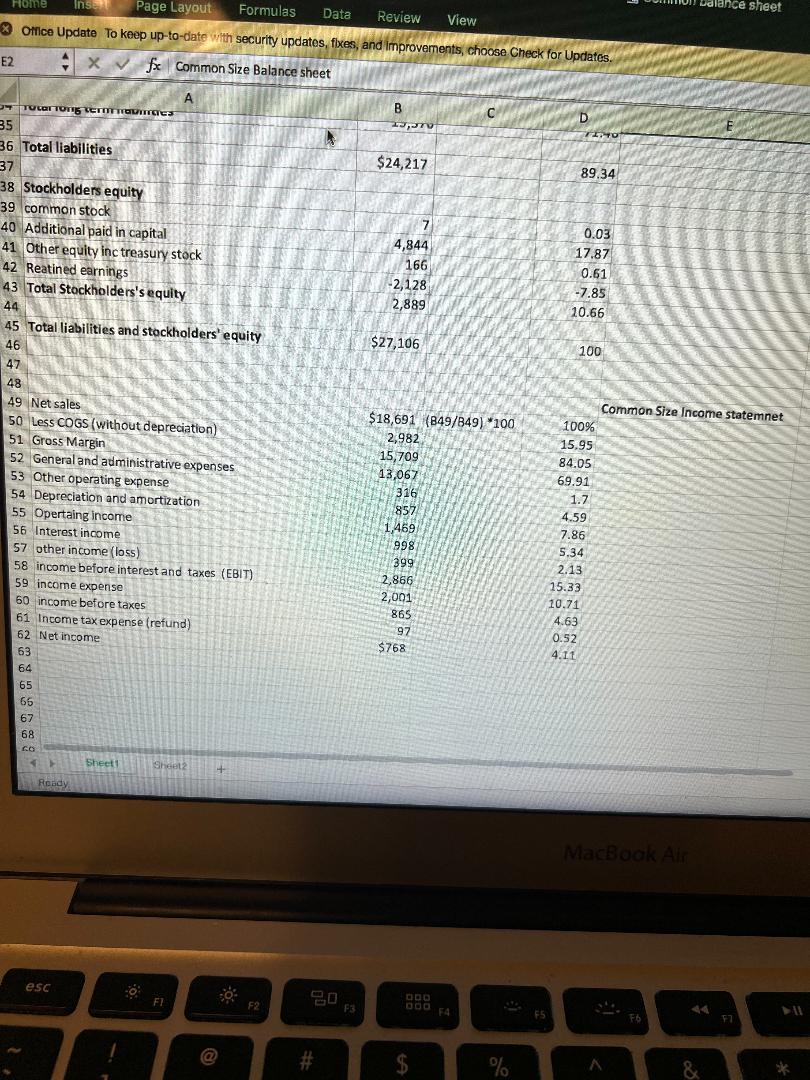
I Part 3 income $768 857 2004 $3626 2300 1424 Cauh klow identity Cash flow from assets current net Ledd bank depreciation expense. add bank interest expense operating cash flow $3626 operating cash How Kuinest working capital (1/47-4342) = = 876 pnul working capital 7508) -4205) increase (decrease) Iles $1924 increase in working capital curest long term avete 19959 leu prior long term amets -78284 subtotal increase (decrease) add depreciation 857 net capital spending leus $2532 net capital spending (-35.26 + 1424 $330._subtotal ach How' proud avets prior long term liabilities They mirent long term liabilities subtotal increase (decrease) 2001 flow creditors 4153 1675 2532 +2532 = 330) 17217 -19370 2153 interest expense ladd cach to Teus other equity 84153 cash flow to creditors. Jonor net umest not other equity Clubtotal increare decrease) dividends paid 4767 5017 *250 382 133 carn how to owners Avet utilization metics = 27106 + 23365 = 25235-5 Gross margin Pengetua bidity medias 15709 / 18691 = 0.84 84%. 768/18691-0.041 = 4:11 Times interest earned = 2866 / 2001 = 1.432 times. caun coverage ratio 2 (2866 +857)/20011.861 times Net profit margin= I Part 1 digidity metrijos Current Ratio 7147 / 4847 = 1.475 times Quick Ratio - 1747 - 368) (4847= 1.399 times and test Ratio - 17147 -368-6192/4847 0.018 times Cash Ratio = (2446/4847) = 0.505 times debt auet ratio (24217 / 27106) = 0.893 times equity multiplier = (27/06/2.889.) = 9:382 times debt equity ratio = (24217 / 2889) = 8.382 times Leverage meies = debt fshareholder's equity = 15574 22889 5.391 times didorking capital amount 7147-4847 2300 Common Size Balance sheet Current year Percentage 2,446 (B5/B19)*100 2,690 368 141 1,502 7,147 9.02% 9.92 1.36 0.52 5.54 26.37 24.69 9.35 6,692 2,534 325 10,408 19,959 1.2 38.4 73.63 Current assets Caash and cash Equivalnets Receivables net of allowance inventories Prepaid espenses Other current assets Total Current assets 1 2 Long term assets 3 Property, plant equipment -4 Investments 15 Deferred Income taxes 16 Intangiable assets 17 Total long term assets 18 19 Total assets 20 21 Current liabiities 22 Current portion of long term debt 23 Accounts payable 24 Accrued liabilities 25 Other Current liabiities 26 Total Current liabilities 27 28 Long term liabilities 29 Long term notes payable 30 Other long term debt 31 Deferred income taxes 32 Deferred pension/postreiremnet benefits 33 Other long term liabilities 34 Total long term liabilities 35 Sheet1 Sheet2 27,106 100 145 (822/845)*100 -6207 0.53 4.45 7.98 4.91 17.88 4.847 739 15.574 20 497 2.535 19,370 2.71 57.46 0.11 1.83 9.35 71.46 Ready MacBook Air esc F1 Bo DOD F2 LES % # 3 2 $ 4. 5 & 7. 6 Q W E R. Y Dalance sheet Flome Insert Page Layout Formulas Data Review View > Onice Update To keep up-to-date with security updates, fixes, and improvements, choose Check for Updates E2 XV for Common Size Balance sheet B 13TV J7 C D E FITO $24,217 89.34 4,844 166 -2,128 2,889 0.03 17.87 0.61 -7.85 10.66 $27,106 100 A TOLOTTONIS ET TOUTES 35 36 Total liabilities 37 38 Stockholders equity 39 common stock 40 Additional paid in capital 41 Other equity inc treasury stock 42 Reatined earnings 43 Total Stockholders's equity 44 45 Total liabilities and stockholders' equity 46 47 48 49 Net sales 50 Less COGS (without depreciation) 51 Gross Margin 52 General and administrative expenses 53 Other operating expense 54 Depreciation and amortization 55 Opertaing income 56 Interest income 57 other income (loss) 58 income before interest and taxes (EBIT) 59 income expense 60 income before taxes 61 Income tax expense (refund) 62 Net income 63 64 65 65 $18,691 (849/849) *100 2,982 15,709 13,067 316 857 1,469 998 399 2,866 2,001 865 97 $768 Common Size Income statemnet 100% 15.95 84.05 69.91 1.7 4.59 7.86 5.34 2.13 15.33 10.71 4.63 0.52 4.11 67 68 CO Sheet Sheet2 + Rondy MacBook Air esc 0 FE F2 F3 CIDO OOO FA F4 # $ o % & I Part 3 income $768 857 2004 $3626 2300 1424 Cauh klow identity Cash flow from assets current net Ledd bank depreciation expense. add bank interest expense operating cash flow $3626 operating cash How Kuinest working capital (1/47-4342) = = 876 pnul working capital 7508) -4205) increase (decrease) Iles $1924 increase in working capital curest long term avete 19959 leu prior long term amets -78284 subtotal increase (decrease) add depreciation 857 net capital spending leus $2532 net capital spending (-35.26 + 1424 $330._subtotal ach How' proud avets prior long term liabilities They mirent long term liabilities subtotal increase (decrease) 2001 flow creditors 4153 1675 2532 +2532 = 330) 17217 -19370 2153 interest expense ladd cach to Teus other equity 84153 cash flow to creditors. Jonor net umest not other equity Clubtotal increare decrease) dividends paid 4767 5017 *250 382 133 carn how to owners Avet utilization metics = 27106 + 23365 = 25235-5 Gross margin Pengetua bidity medias 15709 / 18691 = 0.84 84%. 768/18691-0.041 = 4:11 Times interest earned = 2866 / 2001 = 1.432 times. caun coverage ratio 2 (2866 +857)/20011.861 times Net profit margin= I Part 1 digidity metrijos Current Ratio 7147 / 4847 = 1.475 times Quick Ratio - 1747 - 368) (4847= 1.399 times and test Ratio - 17147 -368-6192/4847 0.018 times Cash Ratio = (2446/4847) = 0.505 times debt auet ratio (24217 / 27106) = 0.893 times equity multiplier = (27/06/2.889.) = 9:382 times debt equity ratio = (24217 / 2889) = 8.382 times Leverage meies = debt fshareholder's equity = 15574 22889 5.391 times didorking capital amount 7147-4847 2300 Common Size Balance sheet Current year Percentage 2,446 (B5/B19)*100 2,690 368 141 1,502 7,147 9.02% 9.92 1.36 0.52 5.54 26.37 24.69 9.35 6,692 2,534 325 10,408 19,959 1.2 38.4 73.63 Current assets Caash and cash Equivalnets Receivables net of allowance inventories Prepaid espenses Other current assets Total Current assets 1 2 Long term assets 3 Property, plant equipment -4 Investments 15 Deferred Income taxes 16 Intangiable assets 17 Total long term assets 18 19 Total assets 20 21 Current liabiities 22 Current portion of long term debt 23 Accounts payable 24 Accrued liabilities 25 Other Current liabiities 26 Total Current liabilities 27 28 Long term liabilities 29 Long term notes payable 30 Other long term debt 31 Deferred income taxes 32 Deferred pension/postreiremnet benefits 33 Other long term liabilities 34 Total long term liabilities 35 Sheet1 Sheet2 27,106 100 145 (822/845)*100 -6207 0.53 4.45 7.98 4.91 17.88 4.847 739 15.574 20 497 2.535 19,370 2.71 57.46 0.11 1.83 9.35 71.46 Ready MacBook Air esc F1 Bo DOD F2 LES % # 3 2 $ 4. 5 & 7. 6 Q W E R. Y Dalance sheet Flome Insert Page Layout Formulas Data Review View > Onice Update To keep up-to-date with security updates, fixes, and improvements, choose Check for Updates E2 XV for Common Size Balance sheet B 13TV J7 C D E FITO $24,217 89.34 4,844 166 -2,128 2,889 0.03 17.87 0.61 -7.85 10.66 $27,106 100 A TOLOTTONIS ET TOUTES 35 36 Total liabilities 37 38 Stockholders equity 39 common stock 40 Additional paid in capital 41 Other equity inc treasury stock 42 Reatined earnings 43 Total Stockholders's equity 44 45 Total liabilities and stockholders' equity 46 47 48 49 Net sales 50 Less COGS (without depreciation) 51 Gross Margin 52 General and administrative expenses 53 Other operating expense 54 Depreciation and amortization 55 Opertaing income 56 Interest income 57 other income (loss) 58 income before interest and taxes (EBIT) 59 income expense 60 income before taxes 61 Income tax expense (refund) 62 Net income 63 64 65 65 $18,691 (849/849) *100 2,982 15,709 13,067 316 857 1,469 998 399 2,866 2,001 865 97 $768 Common Size Income statemnet 100% 15.95 84.05 69.91 1.7 4.59 7.86 5.34 2.13 15.33 10.71 4.63 0.52 4.11 67 68 CO Sheet Sheet2 + Rondy MacBook Air esc 0 FE F2 F3 CIDO OOO FA F4 # $ o % &
Step by Step Solution
There are 3 Steps involved in it

Get step-by-step solutions from verified subject matter experts