

Question: Please use the appropriate attached distribution table: 4. A researcher claims that at least 10% of all football helmets have manufacturing flaws that could potentially
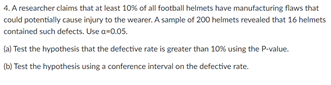
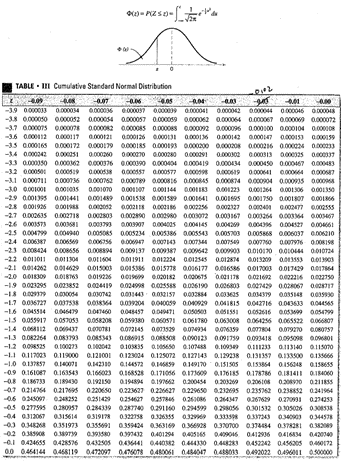
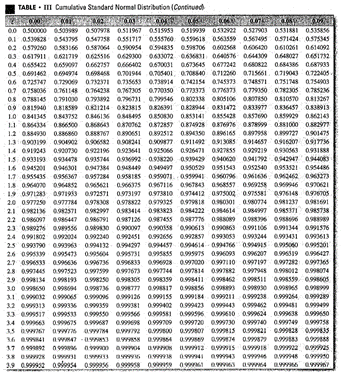
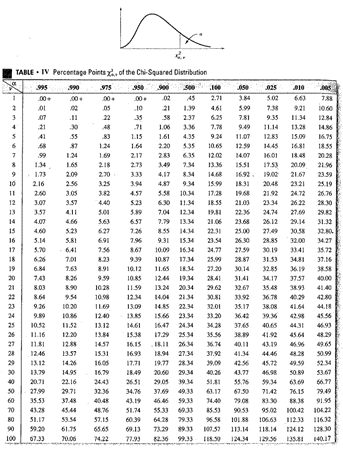
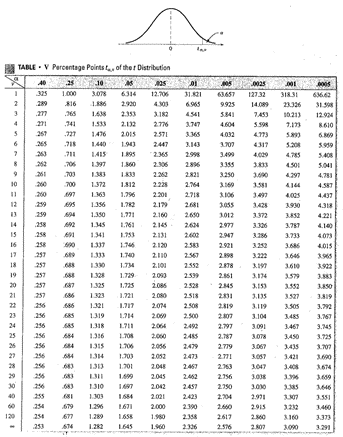
Please use the appropriate attached distribution table:
Step by Step Solution
There are 3 Steps involved in it
1 Expert Approved Answer
Step: 1 Unlock

Question Has Been Solved by an Expert!
Get step-by-step solutions from verified subject matter experts
Step: 2 Unlock
Step: 3 Unlock