

Question: Please use the below table to solve question with program R. I have included both stacked and unstacked datasets, please use whichever is easier. fRefer
Please use the below table to solve question with program R. I have included both stacked and unstacked datasets, please use whichever is easier.
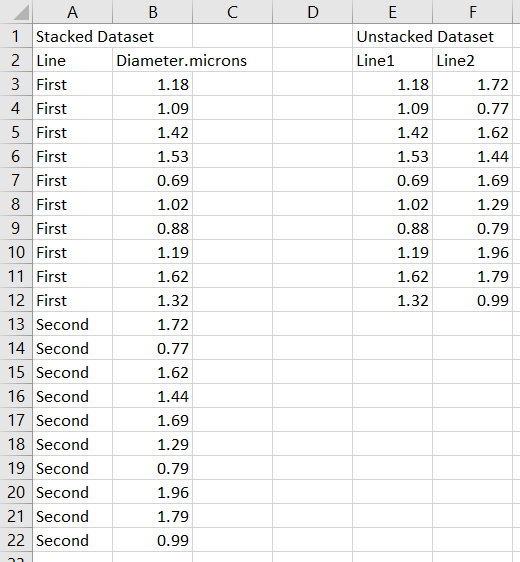
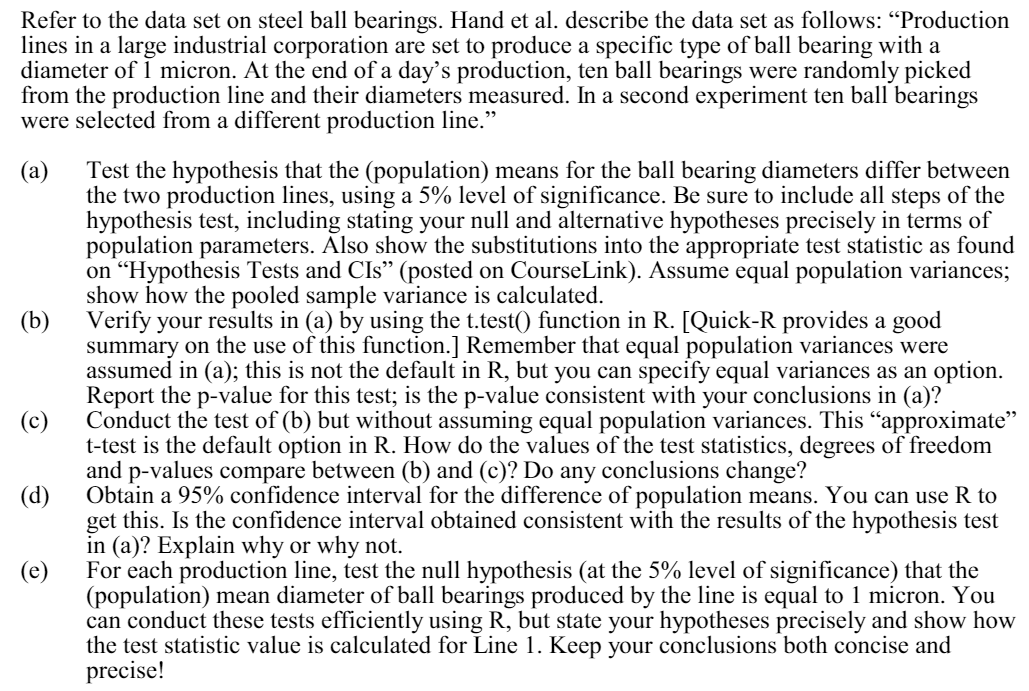
\fRefer to the data set on steel ball bearings. Hand et al. describe the data set as follows: \"Production lines in a large industrial corporation are set to produce a specic type of ball bearing with a diameter of 1 micron. At the end of a day's production, ten ball bearings were randomly picked om the production line and their diameters measured. In a second experiment ten ball hearings were selected from a different production line.\" (a) Test the hypothesis that the (population) means for the ball bearing diameters differ between the two production lines, using a 5% level of signicance. Be sure to include all steps of the hypothesis test, including stating your null and alternative hypotheses precisely in terms of population parameters. Also show the substitutions into the appropriate test statistic as found on \"Hypothesis Tests and Cls\" (posted on CourseLink). Assume equal population variances; show how the pooled sample variance is calculated. (b) Verify your results in (a) by using the t.test() function in R. [Quick-R provides a good summary on the use of this function] Remember that equal population variances were assumed in (a); this is not the default in R, but you can specify equal variances as an option. Report the p-value for this test; is the pvalue consistent with your conclusions in (a)? (c) Conduct the test of (b) but without assuming equal population variances. This \"approximate t-test is the default option in R. How do the values of the test statistics, degrees of freedom and p-values compare between (b) and (c)? Do any conclusions change? (d) Obtain a 95% condence interval for the difference of population means. You can use R to get this. Is the condence interval obtained consistent with the results of the hypothesis test in (a)? Explain why or why not. (e) For each production line, test the null hypothesis (at the 5% level of signicance) that the (population) mean diameter of ball bearings produced by the line is equal to 1 micron. You can conduct these tests efciently using R, but state your hypotheses precisely and show how the test statistic value is calculated for Line 1. Keep your conclusions both concise and precise! 9
Step by Step Solution
There are 3 Steps involved in it

Get step-by-step solutions from verified subject matter experts