

Question: Please use the CSV file WineConsumption. The three columns are 1) State Postal Abbreviation, 2) Population (1000s), and 3) Wine consumption (1000s of gallons). Please
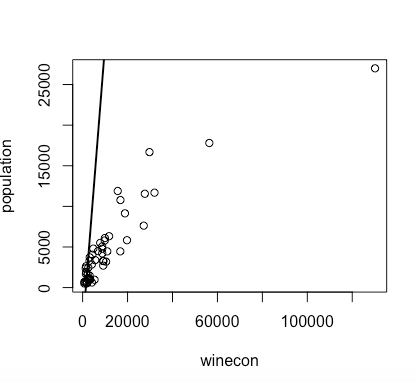
Please use the CSV file "WineConsumption". The three columns are 1) State Postal Abbreviation, 2) Population (1000s), and 3) Wine consumption (1000s of gallons). Please use the scatter plot with a trend line. What does the line briefly tell us? Suppose you want to use population to predict wine consumption. Please use R to run a simple linear regression. Please show the Model Summary Table and Coefficient Table. Is this model good enough? Why or why not? Are you confident in using population to predict wine consumption? Why or why not? Suppose one state's population will be increased by 1 in the coming year, how much more wine will be consumed?
(Hint: To answer the last question, you can write the regression equation from the Coefficient Table: Wine Consumption=a+b*Population.You can use the coefficient b. Or, you can calculate the Wine Consumption under Population=11, and 10, respectively. Then, the difference between the Wine Consumption is the answer.)
(I have done the R runs and included the outputs below with the graph and line. I just need help interpreting it to answer the questions)
*OUTPUTS*
Residuals:
Min1Q Median3QMax
-23323-3883427424641181
Coefficients:
Estimate Std. Error t value Pr(>|t|)
(Intercept) -4995.65011688.5845-2.9580.00475 **
population3.48090.243314.309
---
Signif. codes:0 '***' 0.001 '**' 0.01 '*' 0.05 '.' 0.1 ' ' 1
Residual standard error: 8830 on 49 degrees of freedom
Multiple R-squared:0.8069,Adjusted R-squared:0.8029
F-statistic: 204.7 on 1 and 49 DF,p-value:
GRAPH
\f
Step by Step Solution
There are 3 Steps involved in it

Get step-by-step solutions from verified subject matter experts