

Question: Please use the data from the 2nd picture to answer the 3 part question The All-State Mutual Fund has the following 5-year record of performance:
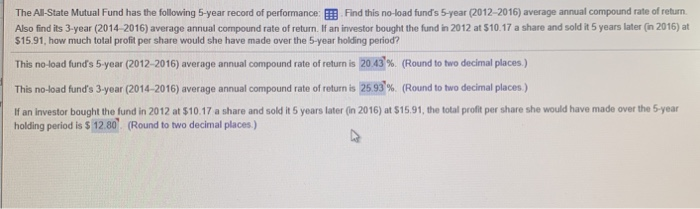
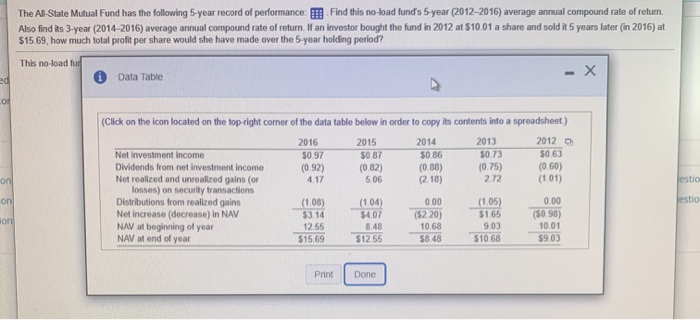
The All-State Mutual Fund has the following 5-year record of performance: Find this no-load fund's 5-year (2012-2016) average annual compound rate of return. Also find its 3-year (2014-2016) average annual compound rate of return. If an investor bought the fund in 2012 at $10.17 a share and sold it 5 years later (in 2016) at $15.91, how much total profit per share would she have made over the 5-year holding period? This no-load fund's 5-year (2012-2016) average annual compound rate of return is 20.43% (Round to two decimal places.) This no-load fund's 3-year (2014-2016) average annual compound rate of return is 25.93%. (Round to two decimal places) If an investor bought the fund in 2012 at $10.17 a share and sold it 5 years later (in 2016) at $15.91, the total profit per share she would have made over the 5-year holding period is $ 12.80 (Round to two decimal places.) The All-State Mutual Fund has the following 5-year record of performance: Find this no-load funds 5-year (2012-2016) average annual compound rate of retur. Also find its 3-year (2014-2016) average annual compound rate of return. If an investor bought the fund in 2012 at $10.01 a share and sold it 5 years later (in 2016) at $15.69, how much total profit per share would she have made over the 5-year holding period? This no load fur Data Table CO on (Click on the icon located on the top-right corner of the data table below in order to copy its contents into a spreadsheet.) 2016 2015 2014 2013 2012 Net investment income $0.97 $0.87 50.86 $0.73 $0.63 Dividends from net investment income (0.92) (0.82) (0.88) (0.75) (0.60) Net realized and unrealized gains (or 4.17 5.06 (2.18) 2.72 (101) losses) on security transactions Distributions from realized gains (1.08) (104) 000 (1.05) 0.00 Net increase (decrease) in NAV $3.14 $4.07 (52 20) $165 (50.98) NAV at beginning of year 12.55 8.48 10 68 9.03 10.01 NAV at end of year $15.69 $12.55 $8.48 $10.68 $9.03 jestio on jestio son Print Done
Step by Step Solution
There are 3 Steps involved in it

Get step-by-step solutions from verified subject matter experts