

Question: Please use the data given to answer the question. Thank you B C D 01/01/1900 0.013055 -0.077656 0.085152 0.09854 02/01/1900 -0.13007 -0.025682 -0.000331 -0.036545 03/01/1900
 Please use the data given to answer the question. Thank you
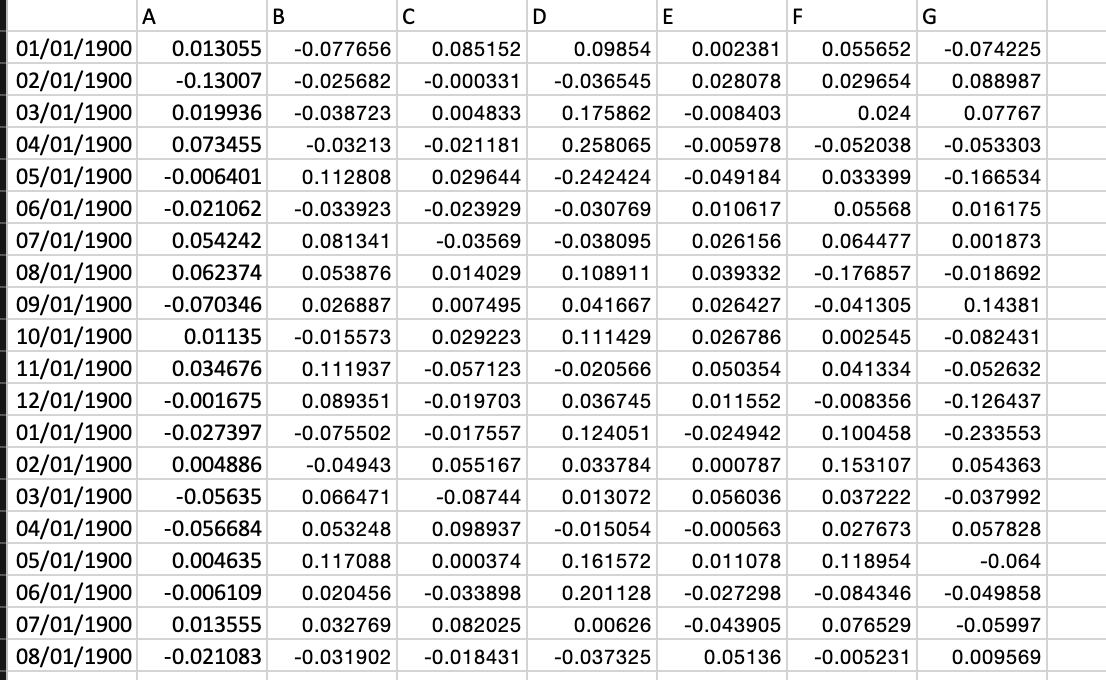
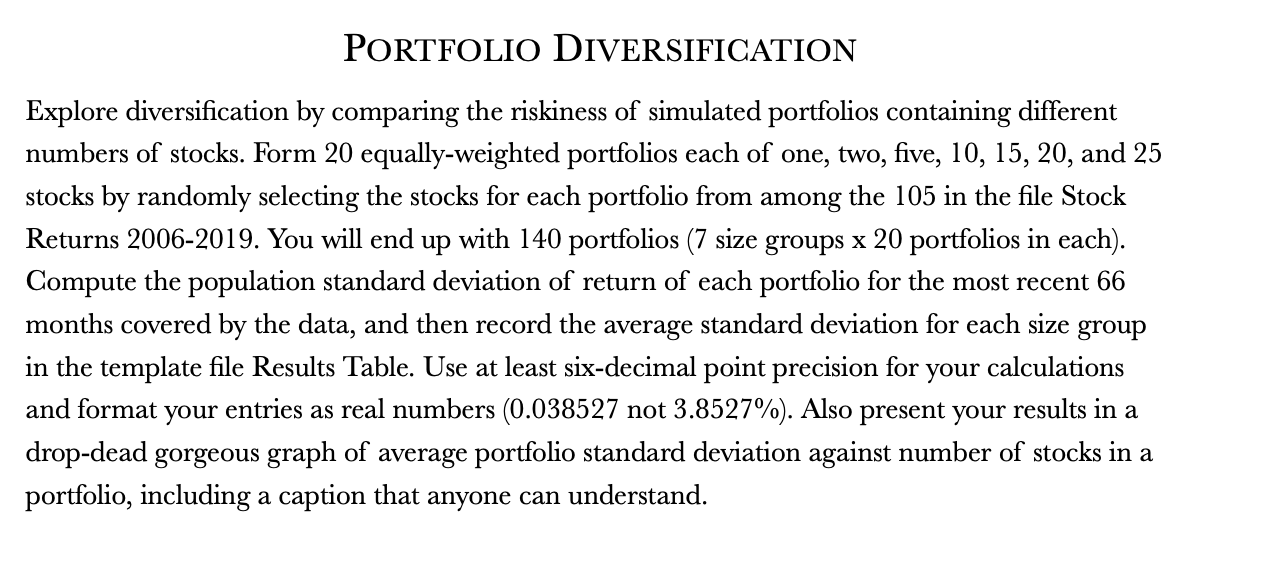
B C D 01/01/1900 0.013055 -0.077656 0.085152 0.09854 02/01/1900 -0.13007 -0.025682 -0.000331 -0.036545 03/01/1900 0.019936 -0.038723 0.004833 0.175862 04/01/1900 0.073455 -0.03213 -0.021181 0.258065 05/01/1900 -0.006401 0.112808 0.029644 -0.242424 06/01/1900 -0.021062 -0.033923 -0.023929 -0.030769 07/01/1900 0.054242 0.081341 -0.03569 -0.038095 08/01/1900 0.062374 0.053876 0.014029 0.108911 09/01/1900 -0.070346 0.026887 0.007495 0.041667 10/01/1900 0.01135 -0.015573 0.029223 0.111429 11/01/1900 0.034676 0.111937 -0.057123 -0.020566 12/01/1900 -0.001675 0.089351 -0.019703 0.036745 01/01/1900 -0.027397 -0.075502 -0.017557 0.124051 02/01/1900 0.004886 -0.04943 0.055167 0.033784 03/01/1900 -0.05635 0.066471 -0.08744 0.013072 04/01/1900 -0.056684 0.053248 0.098937 -0.015054 05/01/1900 0.004635 0.117088 0.000374 0.161572 06/01/1900 -0.006109 0.020456 -0.033898 0.201128 07/01/1900 0.013555 0.032769 0.082025 0.00626 08/01/1900 -0.021083 -0.031902 -0.018431 -0.037325 E F 0.002381 0.028078 -0.008403 -0.005978 -0.049184 0.010617 0.026156 0.039332 0.026427 0.026786 0.050354 0.011552 -0.024942 G 0.055652 -0.074225 0.029654 0.088987 0.024 0.07767 -0.052038 -0.053303 0.033399 -0.166534 0.05568 0.016175 0.064477 0.001873 -0.176857 -0.018692 -0.041305 0.14381 0.002545 -0.082431 0.041334 -0.052632 -0.008356 -0.126437 0.100458 -0.233553 0.153107 0.054363 0.037222 -0.037992 0.027673 0.057828 0.000787 0.056036 -0.000563 0.011078 -0.064 0.118954 -0.084346 -0.027298 -0.043905 0.076529 -0.049858 -0.05997 0.009569 0.05136 -0.005231 PORTFOLIO DIVERSIFICATION Explore diversification by comparing the riskiness of simulated portfolios containing different numbers of stocks. Form 20 equally-weighted portfolios each of one, two, five, 10, 15, 20, and 25 stocks by randomly selecting the stocks for each portfolio from among the 105 in the file Stock Returns 2006-2019. You will end up with 140 portfolios (7 size groups x 20 portfolios in each). Compute the population standard deviation of return of each portfolio for the most recent 66 months covered by the data, and then record the average standard deviation for each size group in the template file Results Table. Use at least six-decimal point precision for your calculations and format your entries as real numbers (0.038527 not 3.8527%). Also present your results in a drop-dead gorgeous graph of average portfolio standard deviation against number of stocks in a portfolio, including a caption that anyone can understand. B C D 01/01/1900 0.013055 -0.077656 0.085152 0.09854 02/01/1900 -0.13007 -0.025682 -0.000331 -0.036545 03/01/1900 0.019936 -0.038723 0.004833 0.175862 04/01/1900 0.073455 -0.03213 -0.021181 0.258065 05/01/1900 -0.006401 0.112808 0.029644 -0.242424 06/01/1900 -0.021062 -0.033923 -0.023929 -0.030769 07/01/1900 0.054242 0.081341 -0.03569 -0.038095 08/01/1900 0.062374 0.053876 0.014029 0.108911 09/01/1900 -0.070346 0.026887 0.007495 0.041667 10/01/1900 0.01135 -0.015573 0.029223 0.111429 11/01/1900 0.034676 0.111937 -0.057123 -0.020566 12/01/1900 -0.001675 0.089351 -0.019703 0.036745 01/01/1900 -0.027397 -0.075502 -0.017557 0.124051 02/01/1900 0.004886 -0.04943 0.055167 0.033784 03/01/1900 -0.05635 0.066471 -0.08744 0.013072 04/01/1900 -0.056684 0.053248 0.098937 -0.015054 05/01/1900 0.004635 0.117088 0.000374 0.161572 06/01/1900 -0.006109 0.020456 -0.033898 0.201128 07/01/1900 0.013555 0.032769 0.082025 0.00626 08/01/1900 -0.021083 -0.031902 -0.018431 -0.037325 E F 0.002381 0.028078 -0.008403 -0.005978 -0.049184 0.010617 0.026156 0.039332 0.026427 0.026786 0.050354 0.011552 -0.024942 G 0.055652 -0.074225 0.029654 0.088987 0.024 0.07767 -0.052038 -0.053303 0.033399 -0.166534 0.05568 0.016175 0.064477 0.001873 -0.176857 -0.018692 -0.041305 0.14381 0.002545 -0.082431 0.041334 -0.052632 -0.008356 -0.126437 0.100458 -0.233553 0.153107 0.054363 0.037222 -0.037992 0.027673 0.057828 0.000787 0.056036 -0.000563 0.011078 -0.064 0.118954 -0.084346 -0.027298 -0.043905 0.076529 -0.049858 -0.05997 0.009569 0.05136 -0.005231 PORTFOLIO DIVERSIFICATION Explore diversification by comparing the riskiness of simulated portfolios containing different numbers of stocks. Form 20 equally-weighted portfolios each of one, two, five, 10, 15, 20, and 25 stocks by randomly selecting the stocks for each portfolio from among the 105 in the file Stock Returns 2006-2019. You will end up with 140 portfolios (7 size groups x 20 portfolios in each). Compute the population standard deviation of return of each portfolio for the most recent 66 months covered by the data, and then record the average standard deviation for each size group in the template file Results Table. Use at least six-decimal point precision for your calculations and format your entries as real numbers (0.038527 not 3.8527%). Also present your results in a drop-dead gorgeous graph of average portfolio standard deviation against number of stocks in a portfolio, including a caption that anyone can understand
Step by Step Solution
There are 3 Steps involved in it

Get step-by-step solutions from verified subject matter experts