Question: Please use the excel doc (i couldnt attach a file so i added screenshots) attached and the information to solve the last 10 questions. thank
Please use the excel doc (i couldnt attach a file so i added screenshots) attached and the information to solve the last 10 questions. thank you!
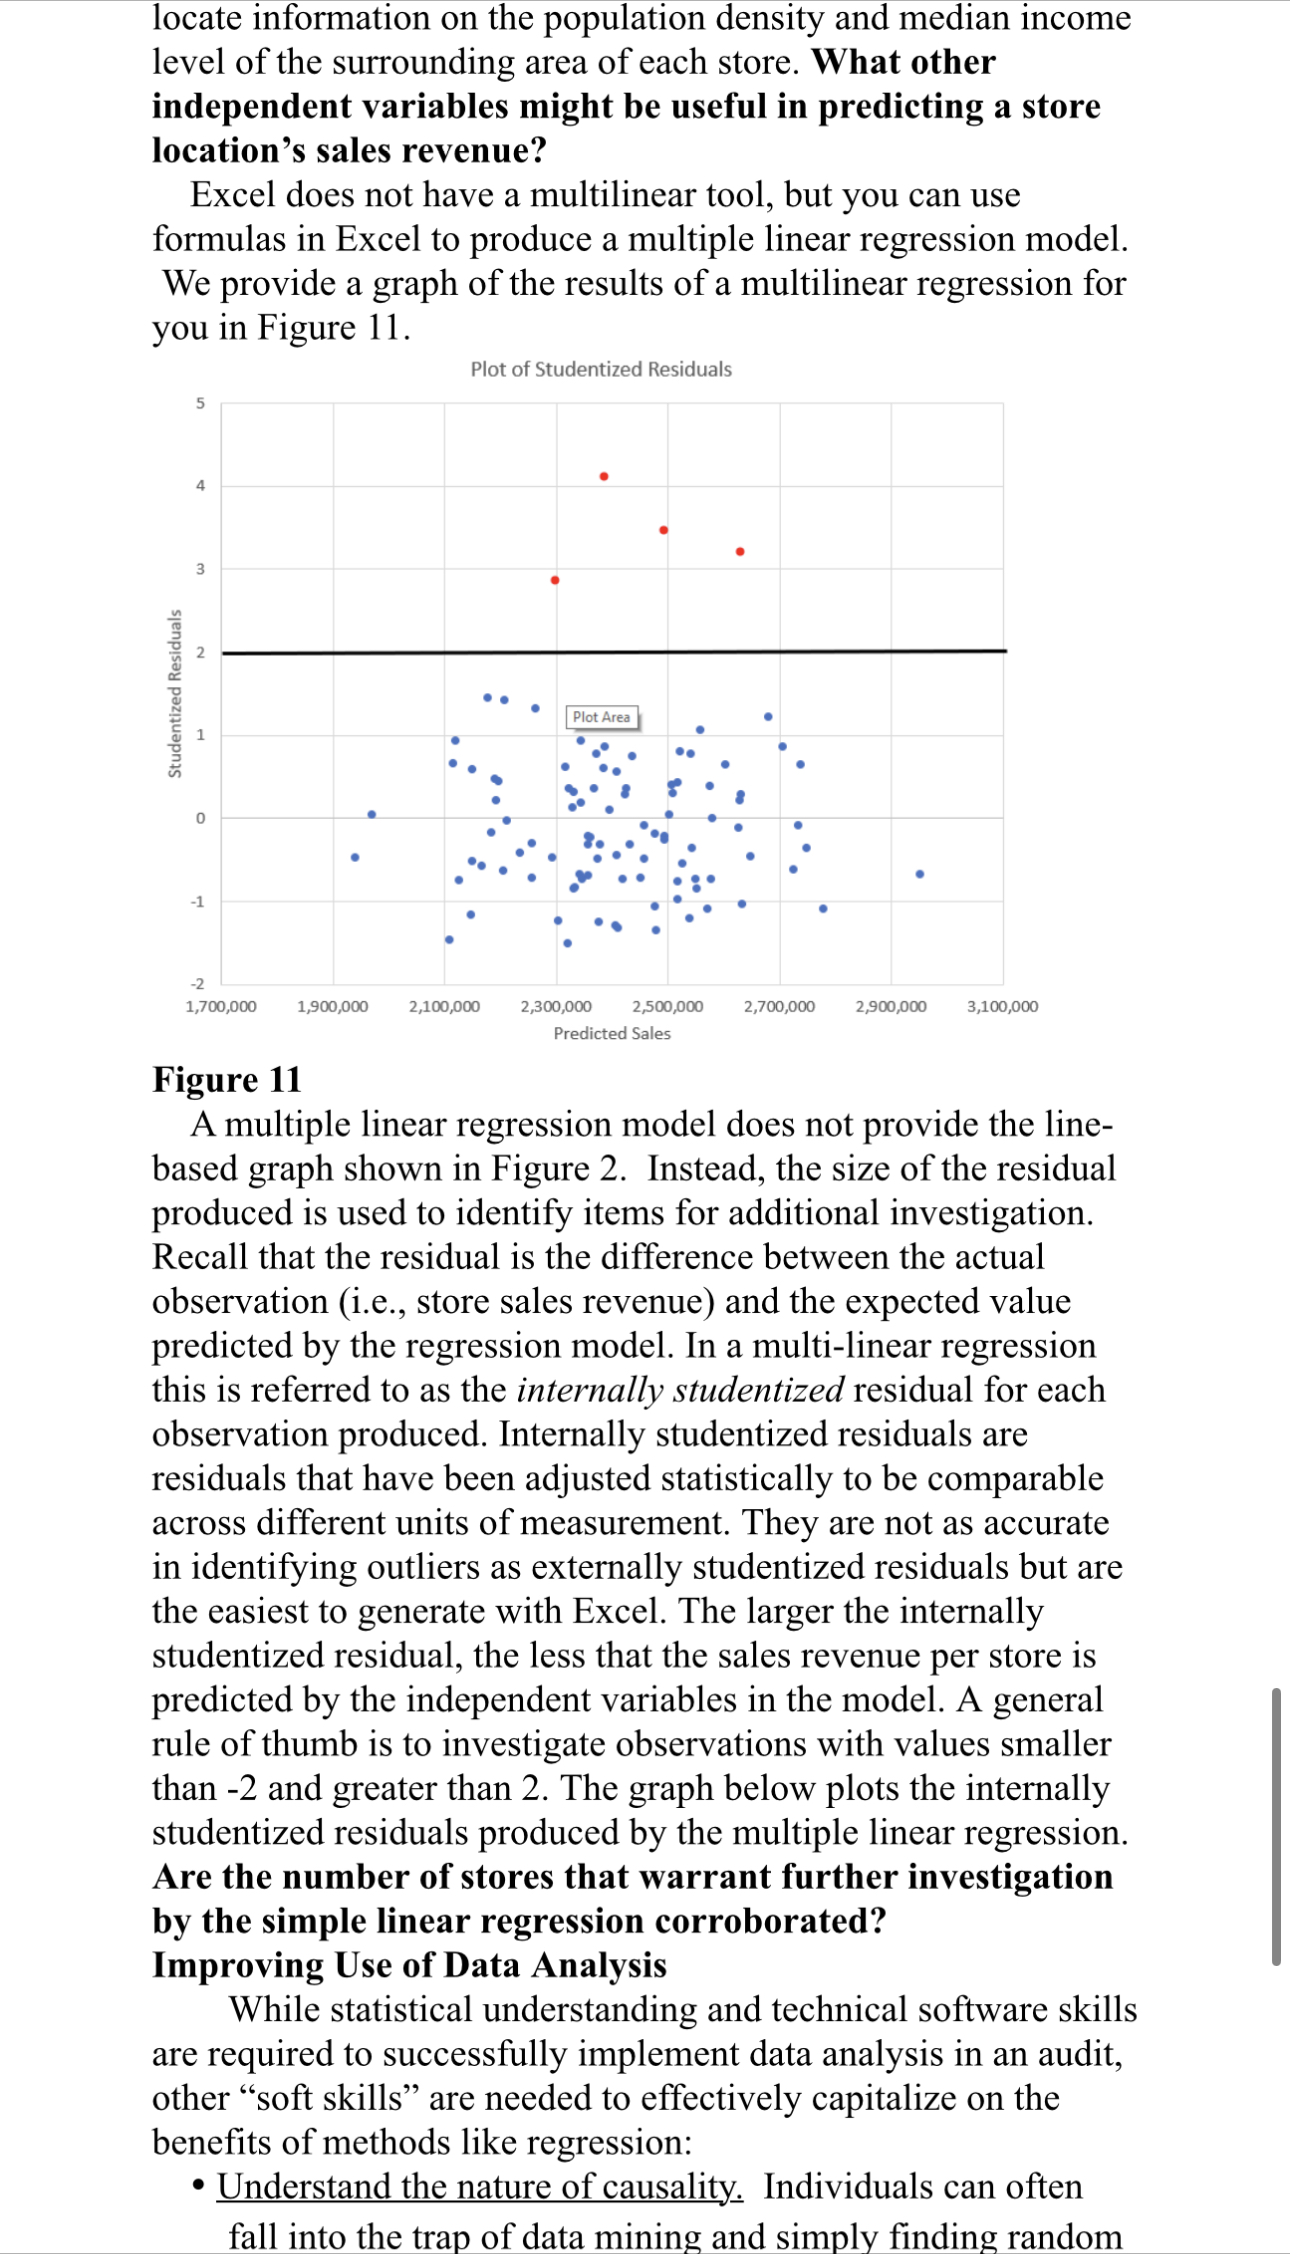
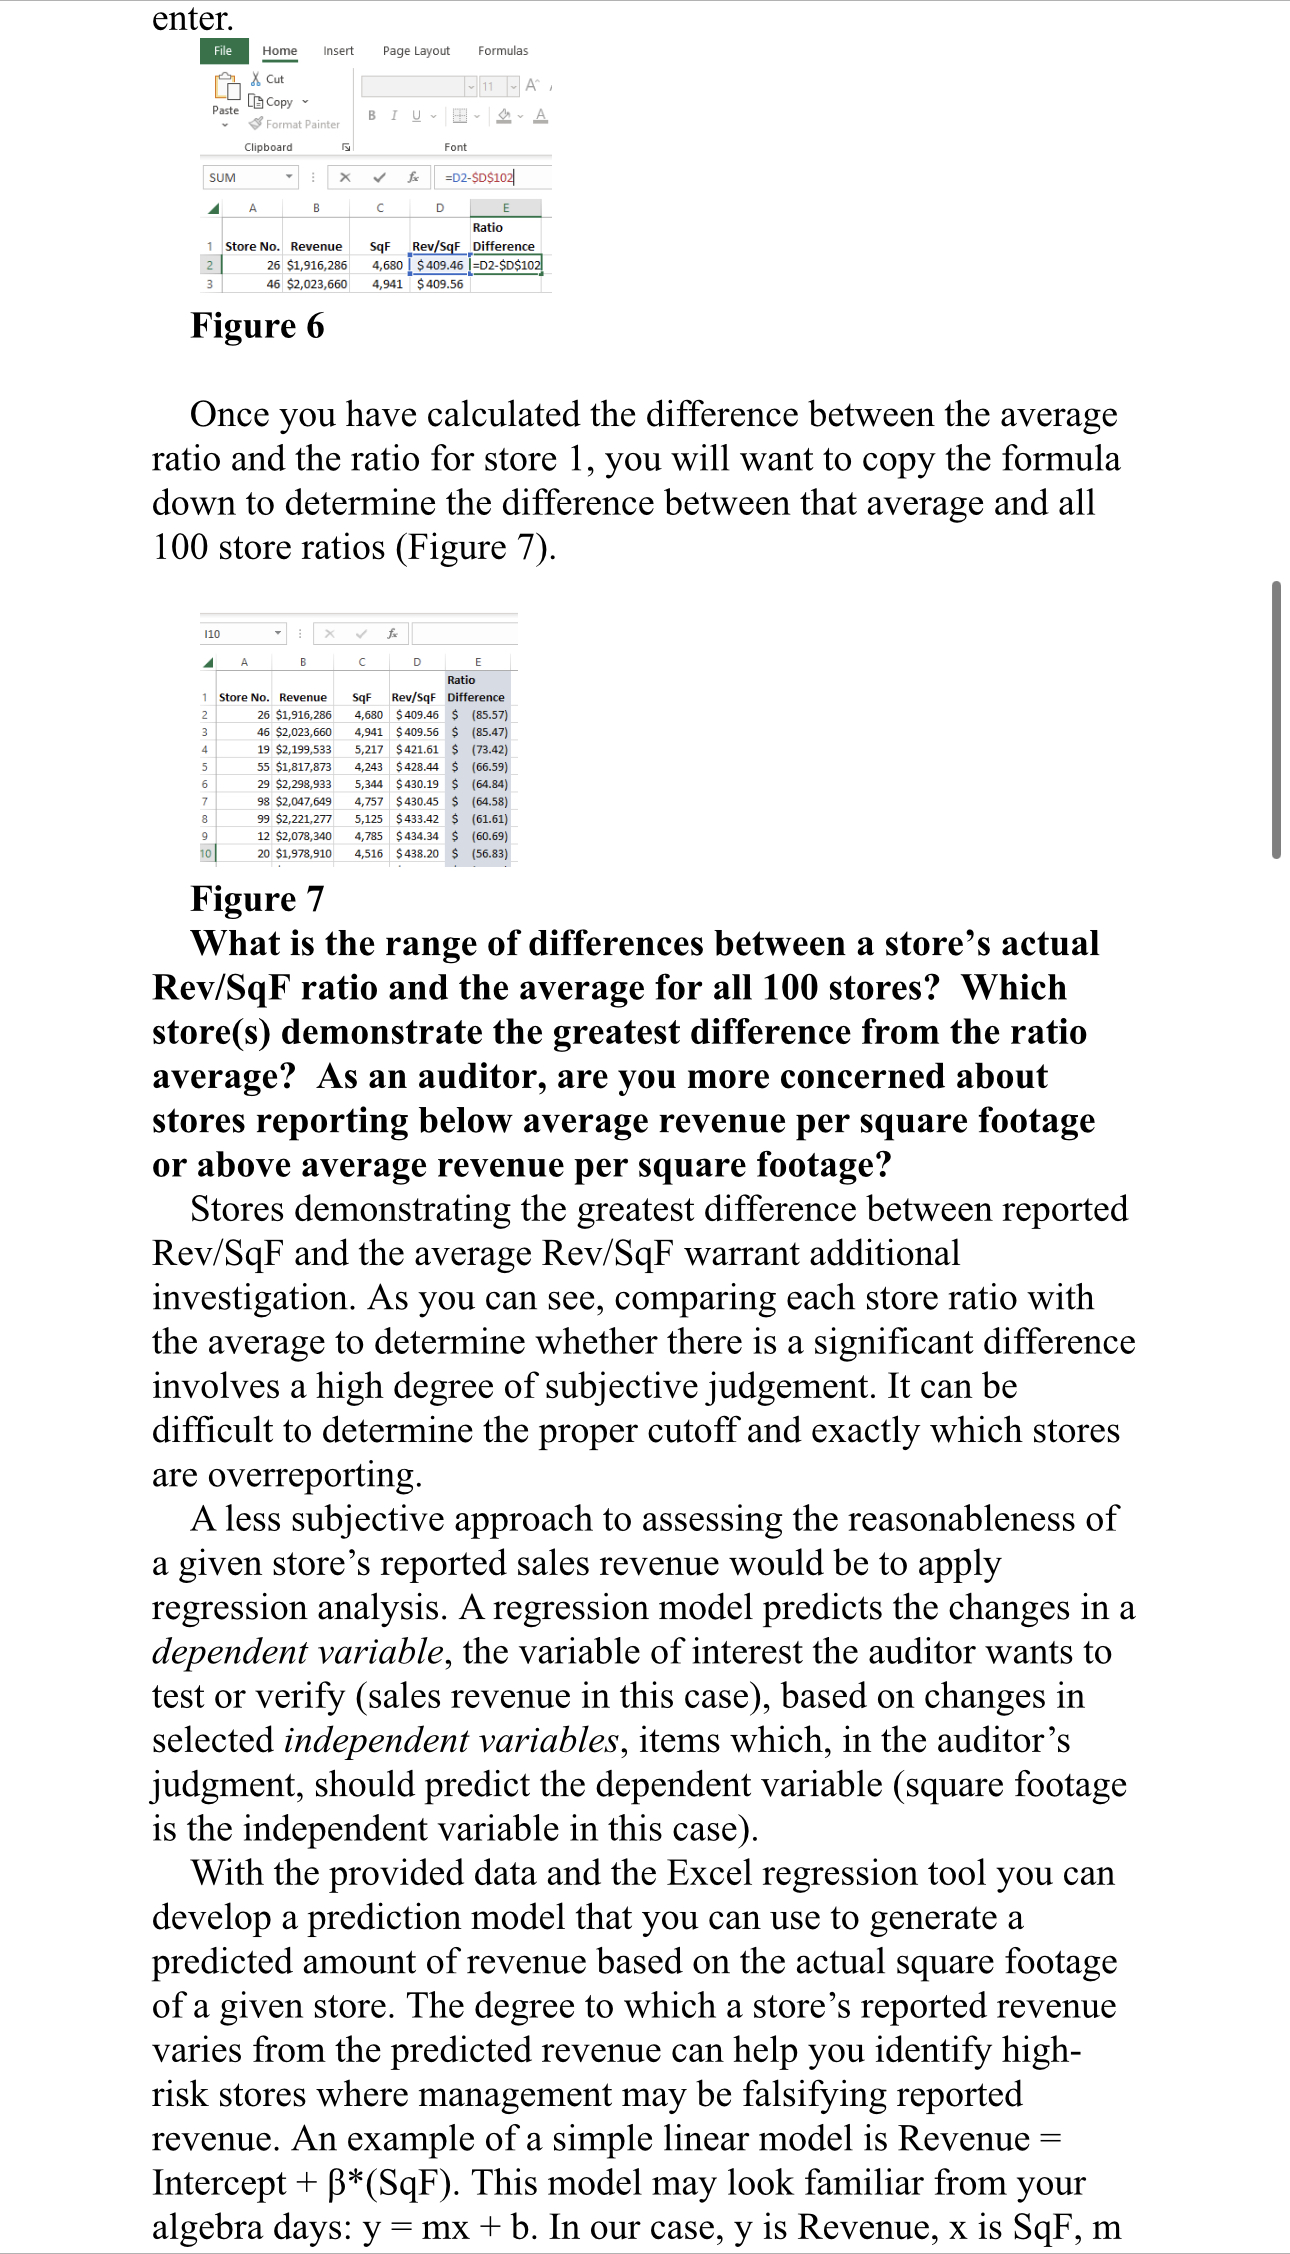
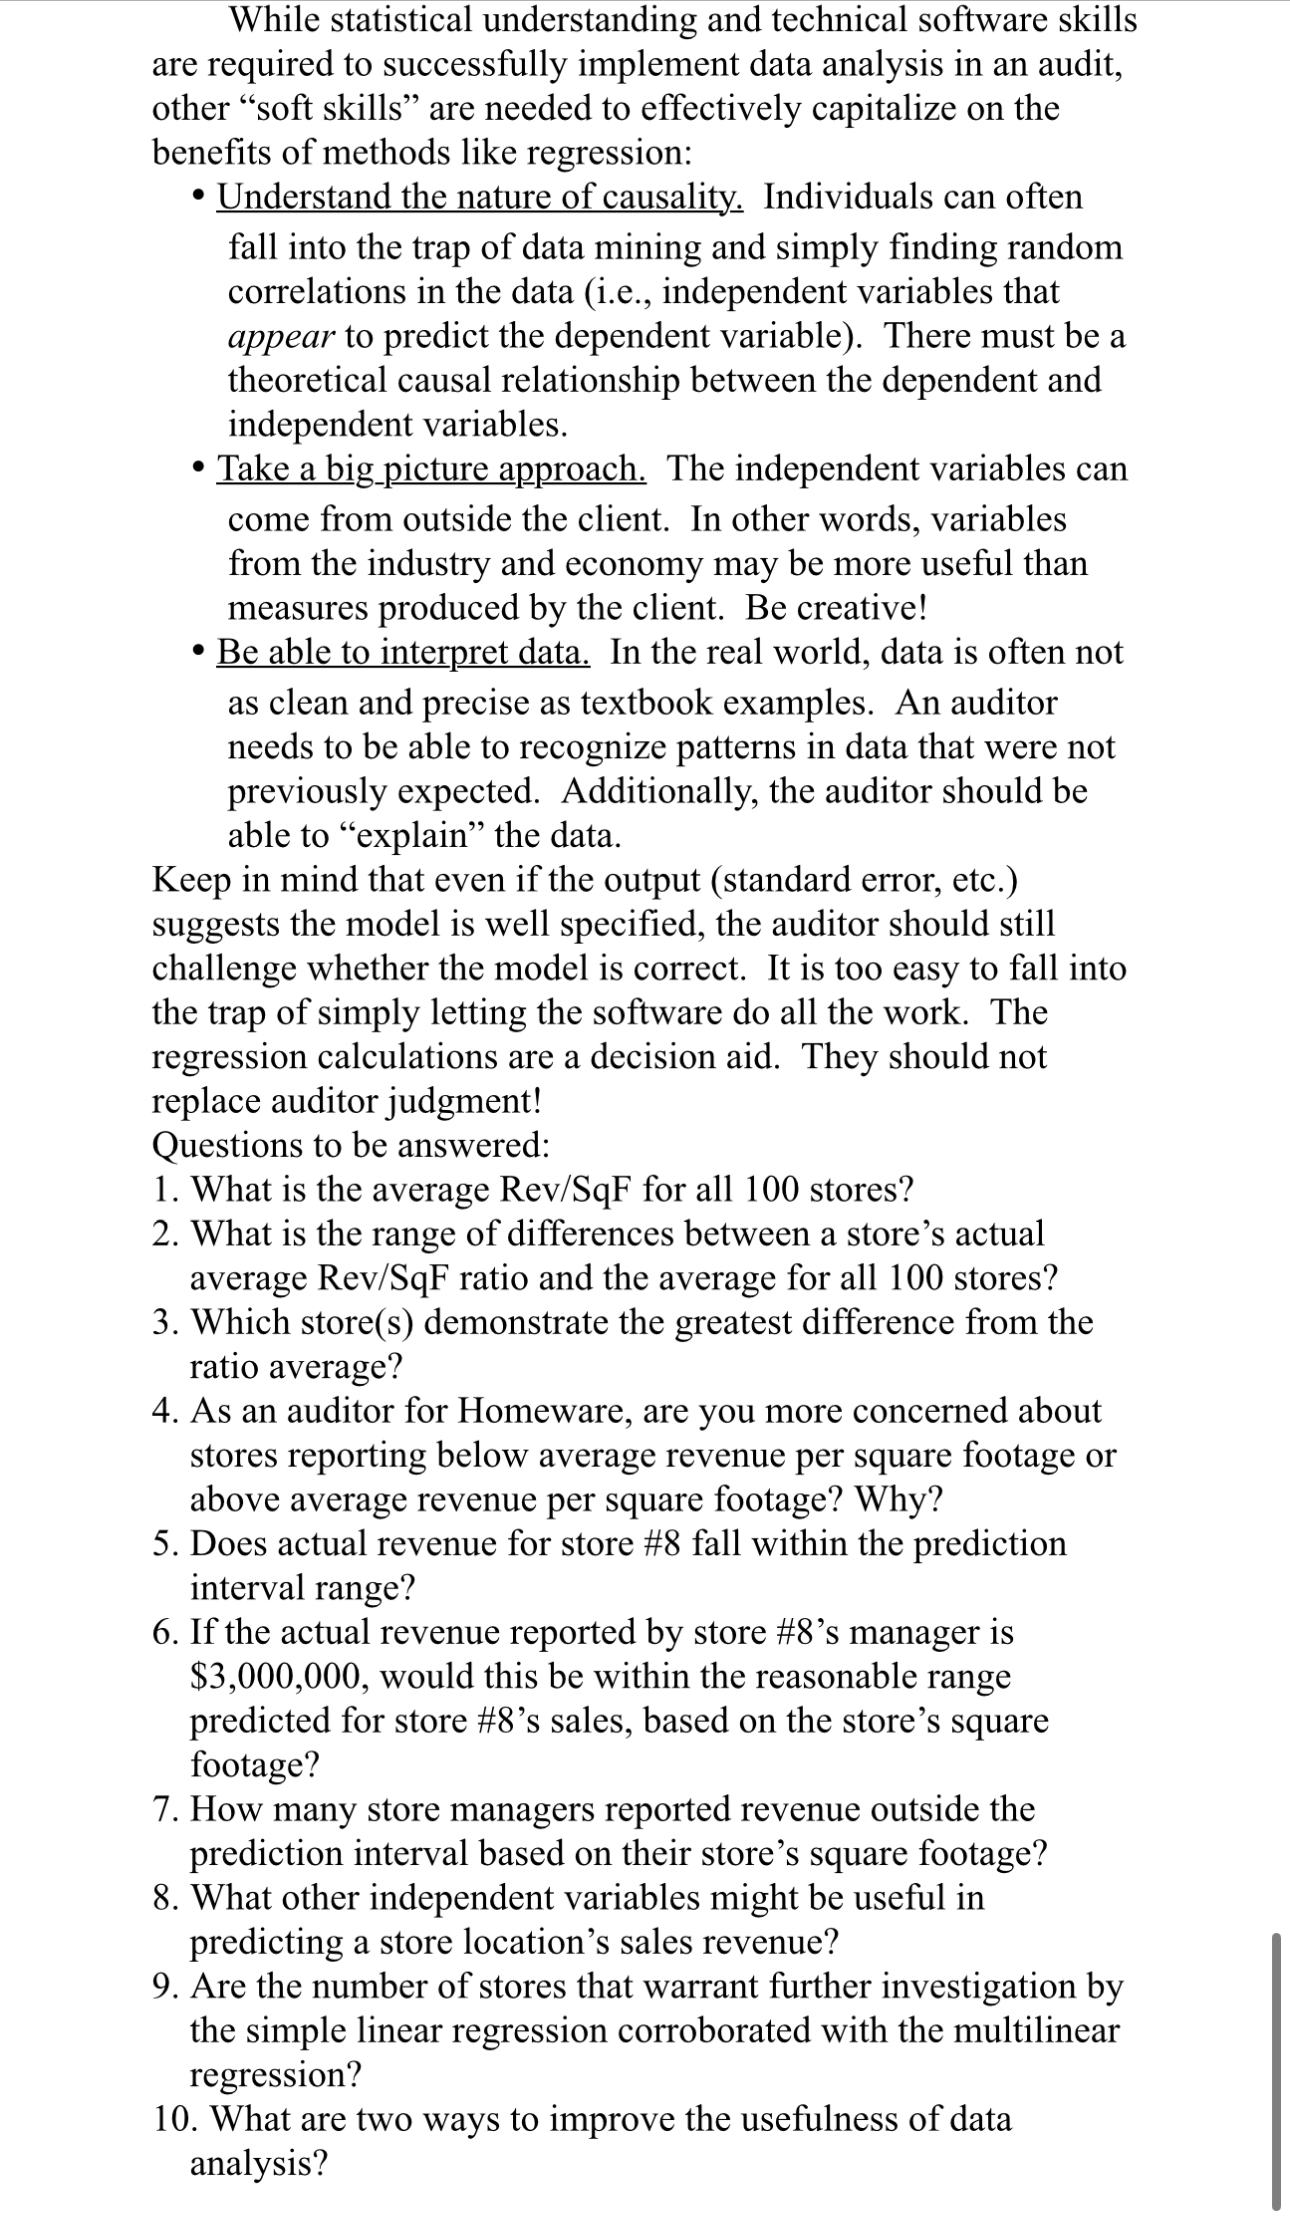
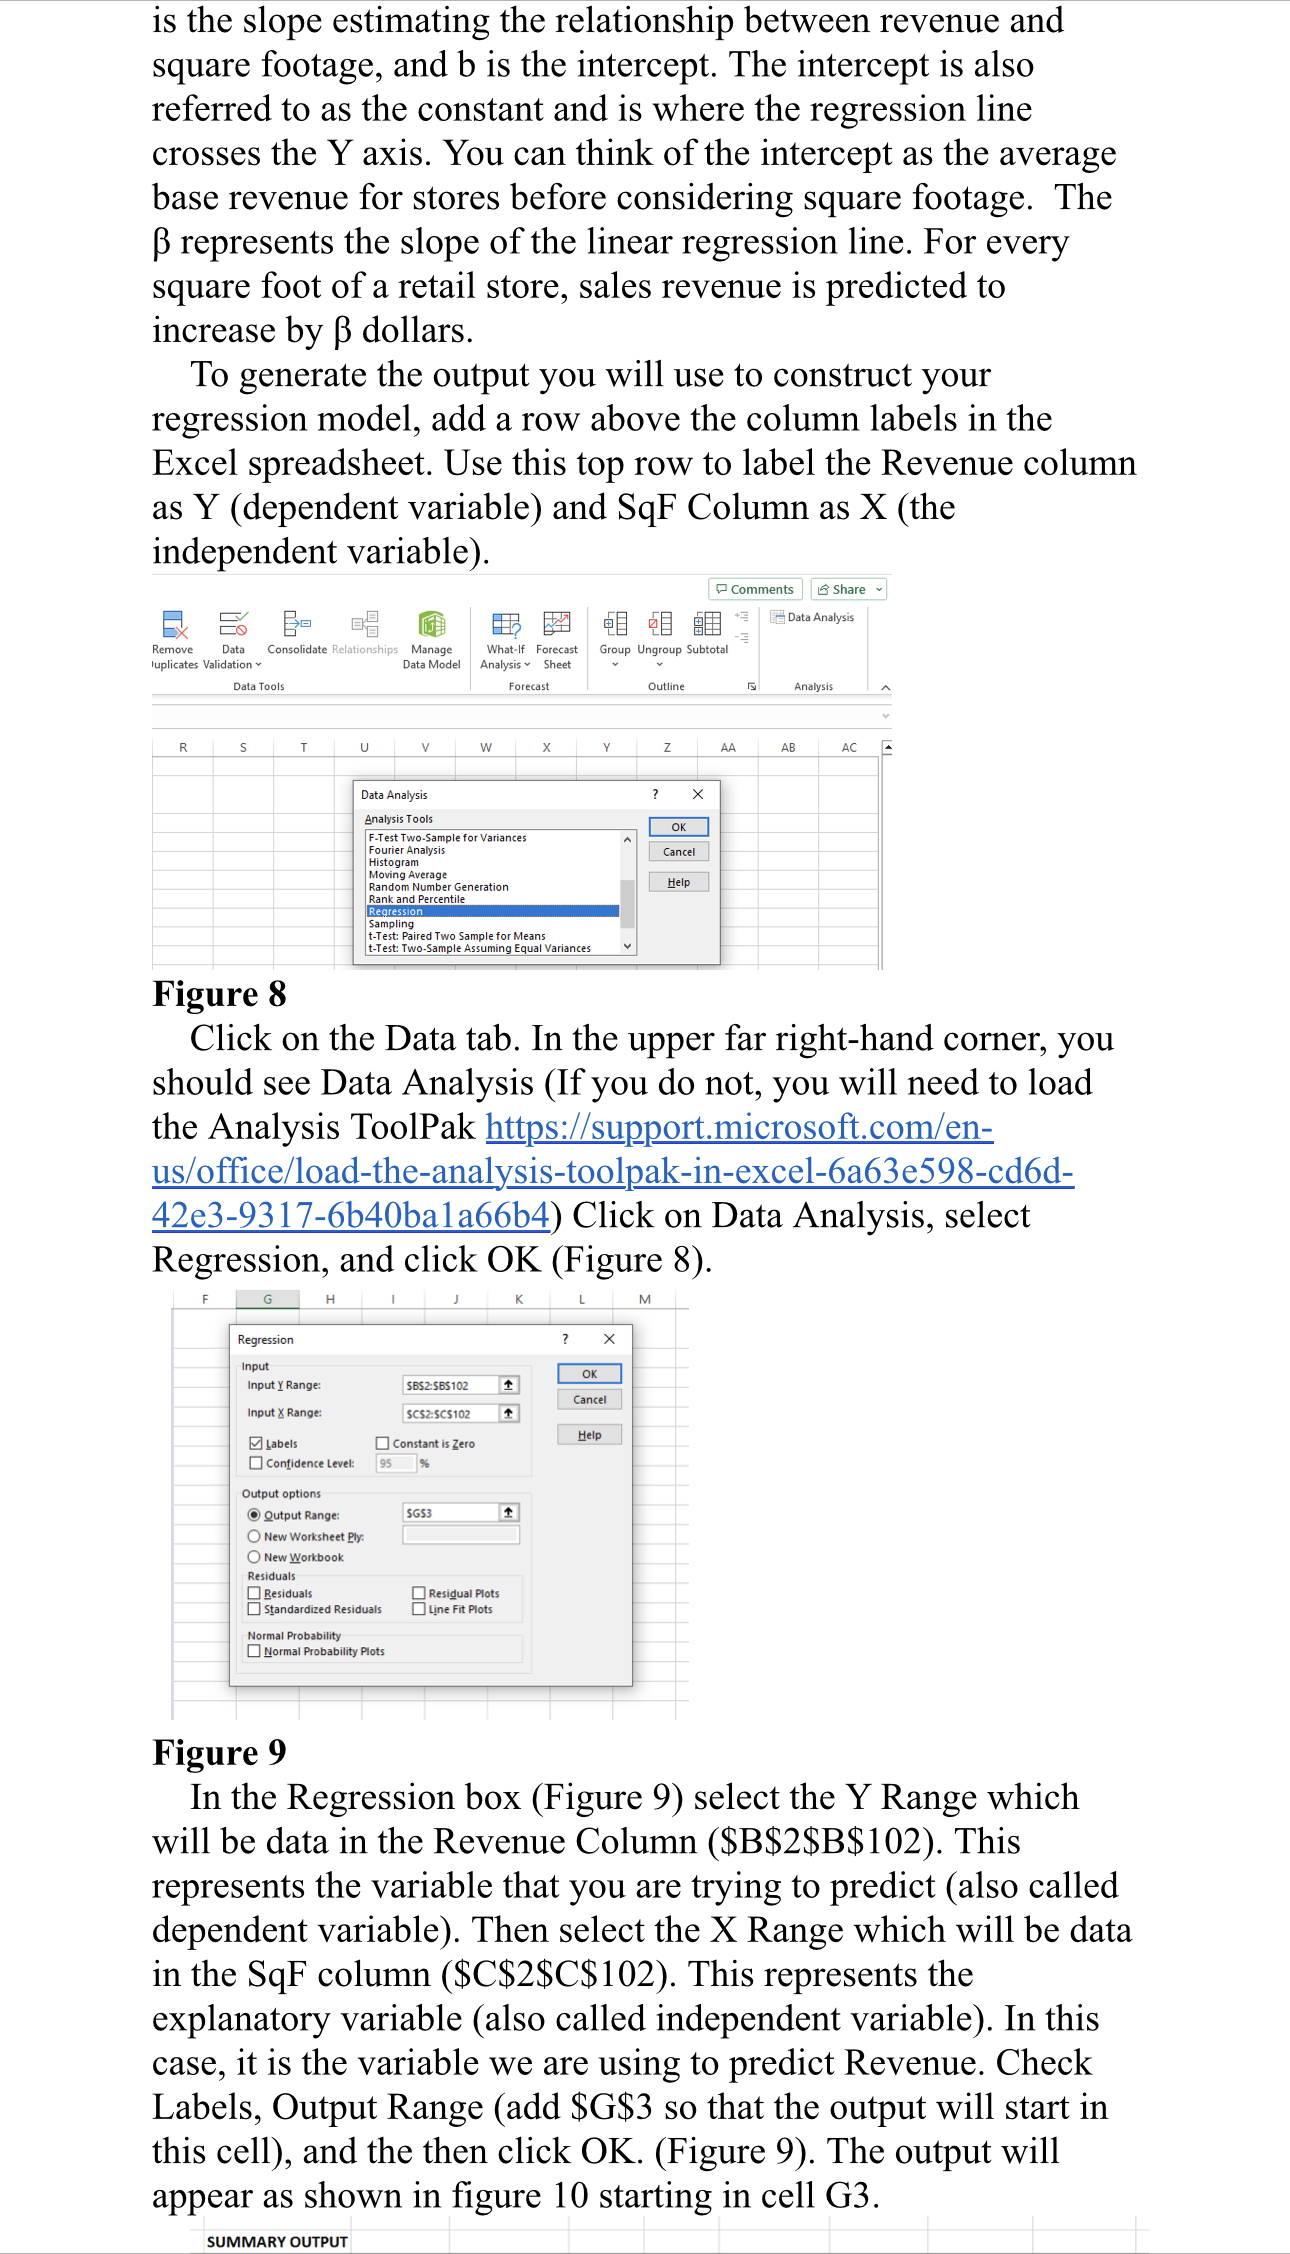
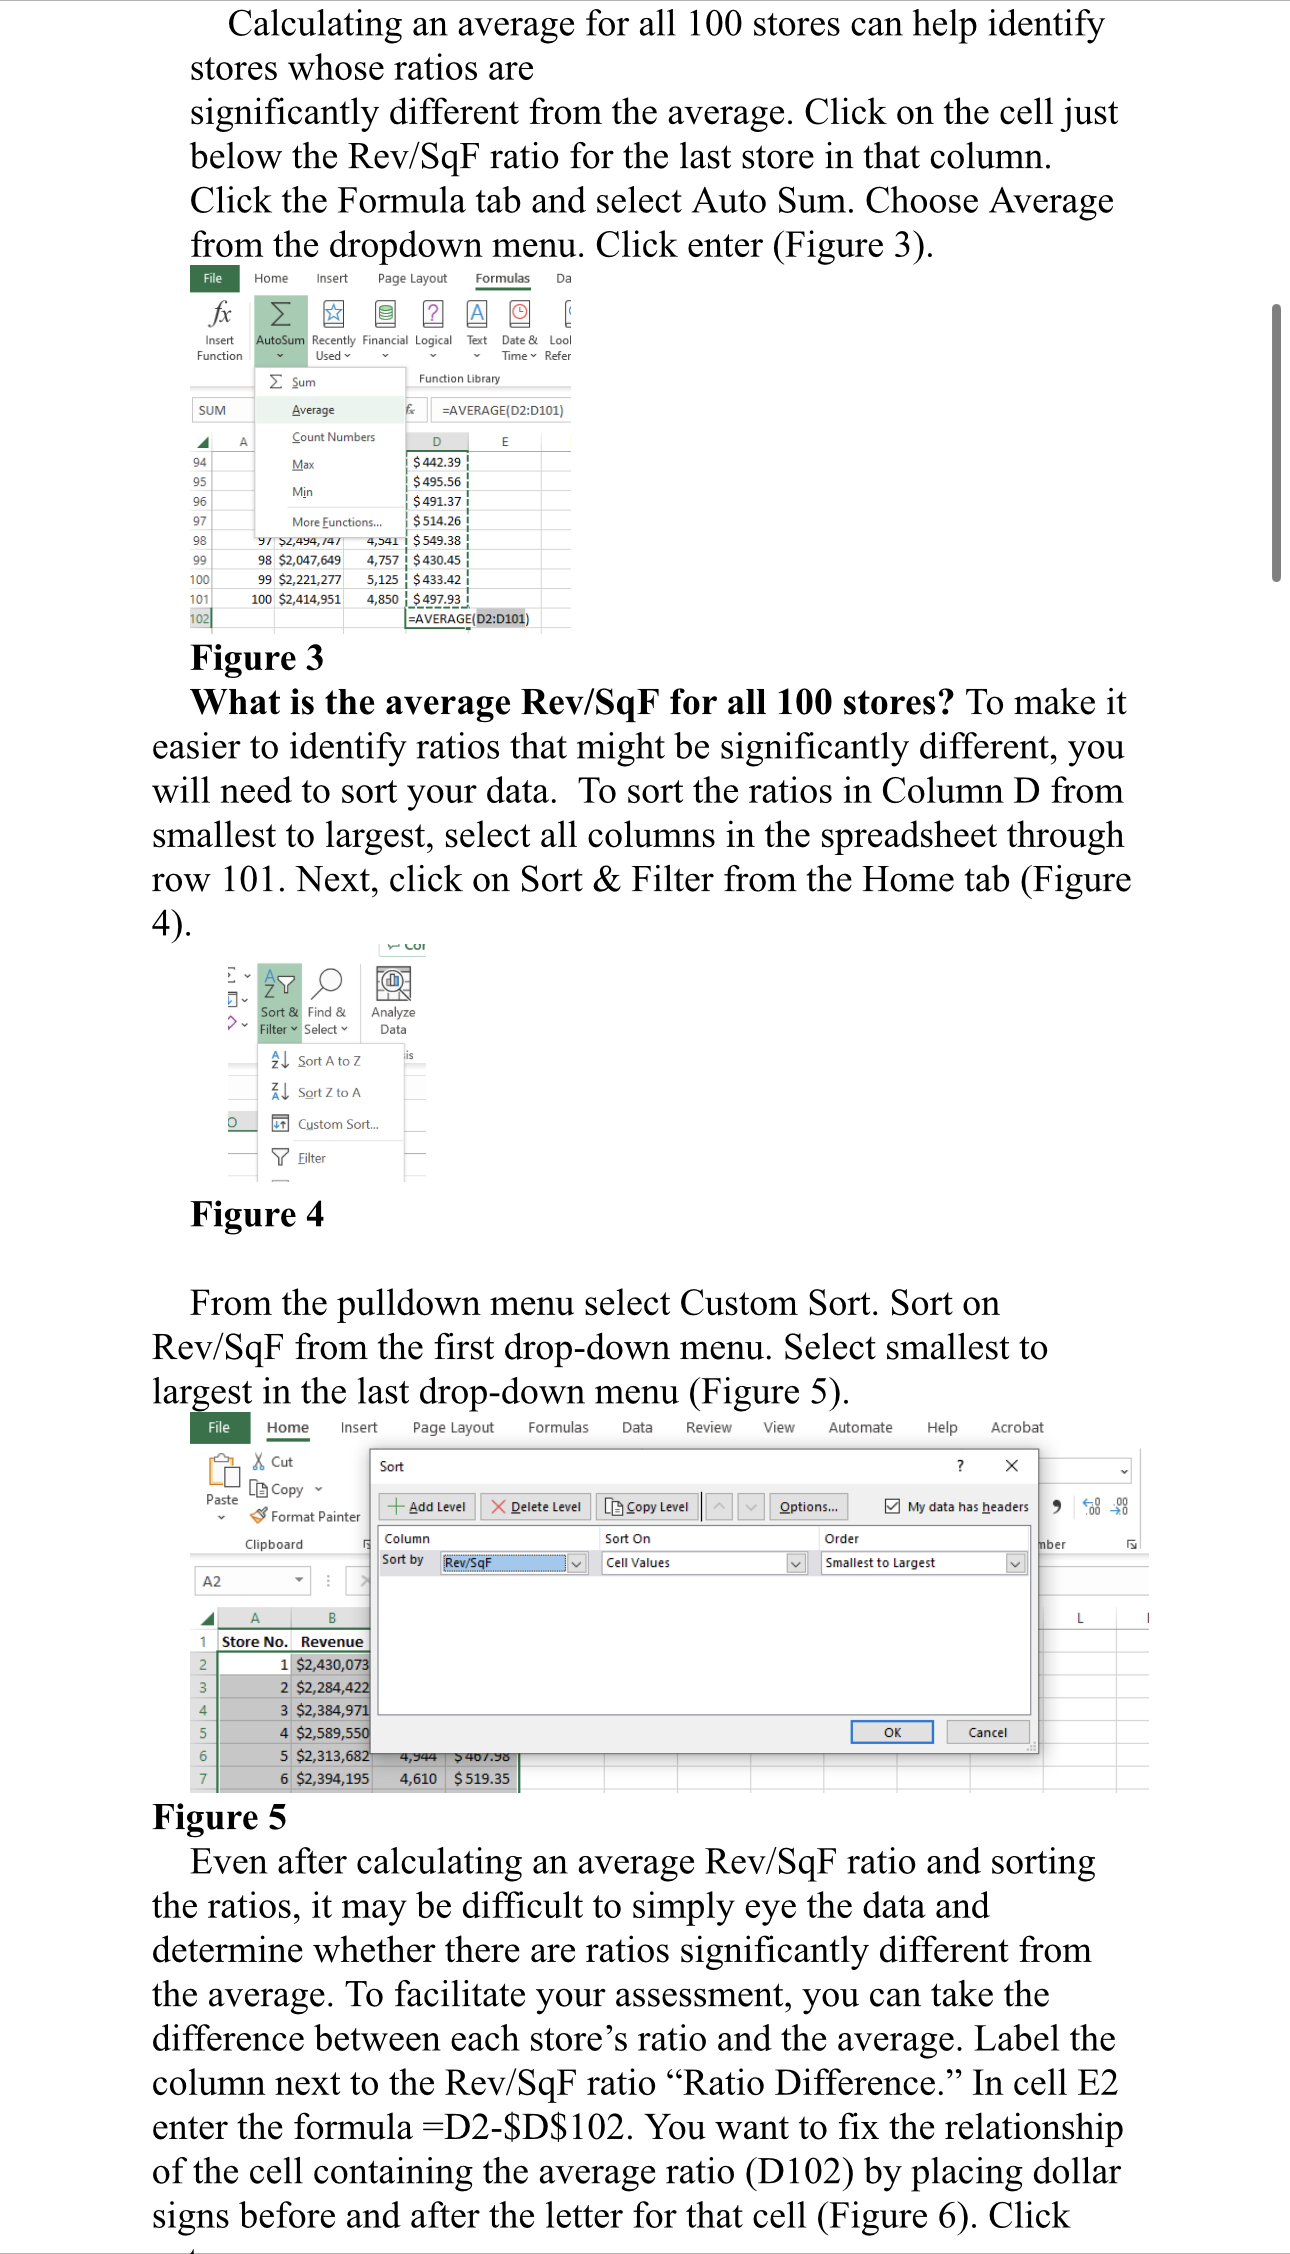
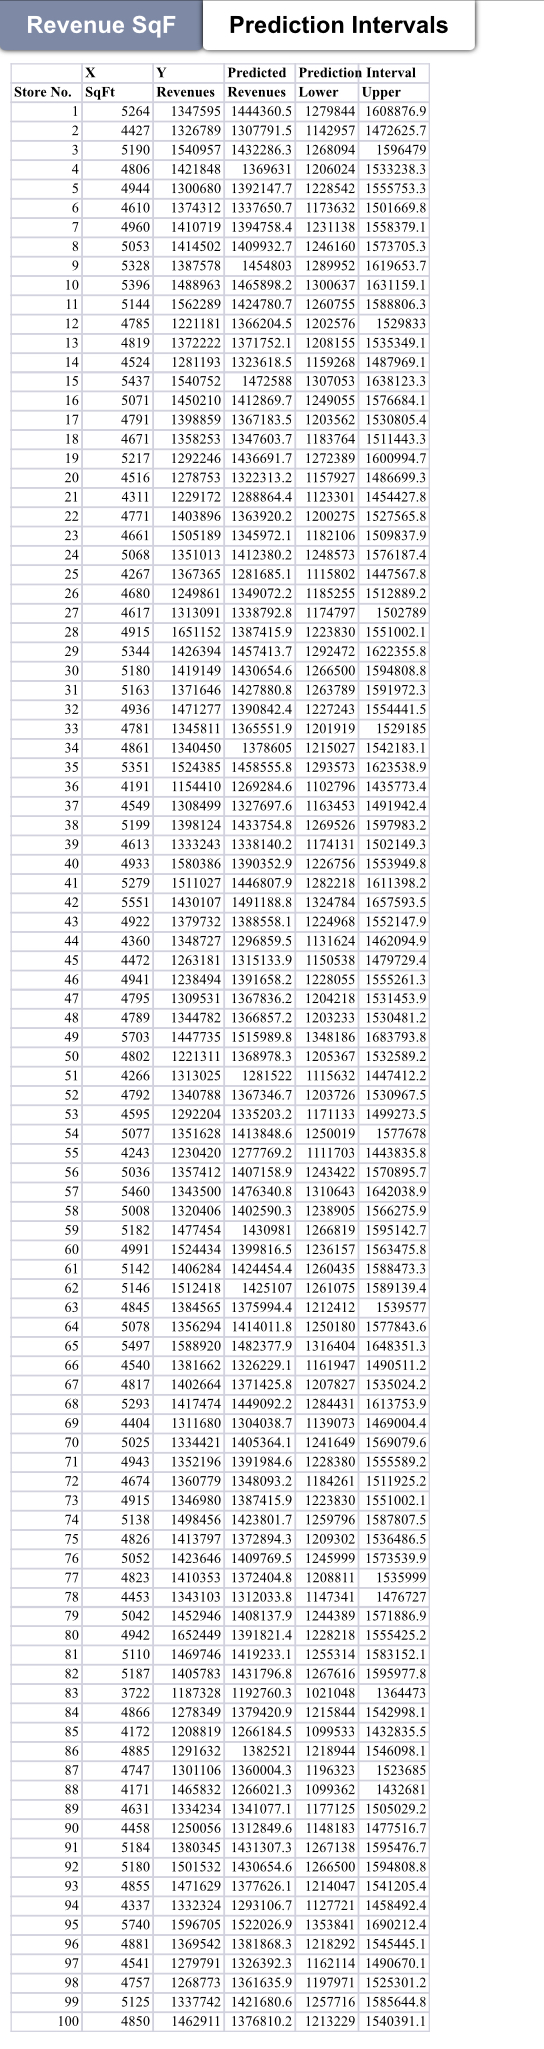
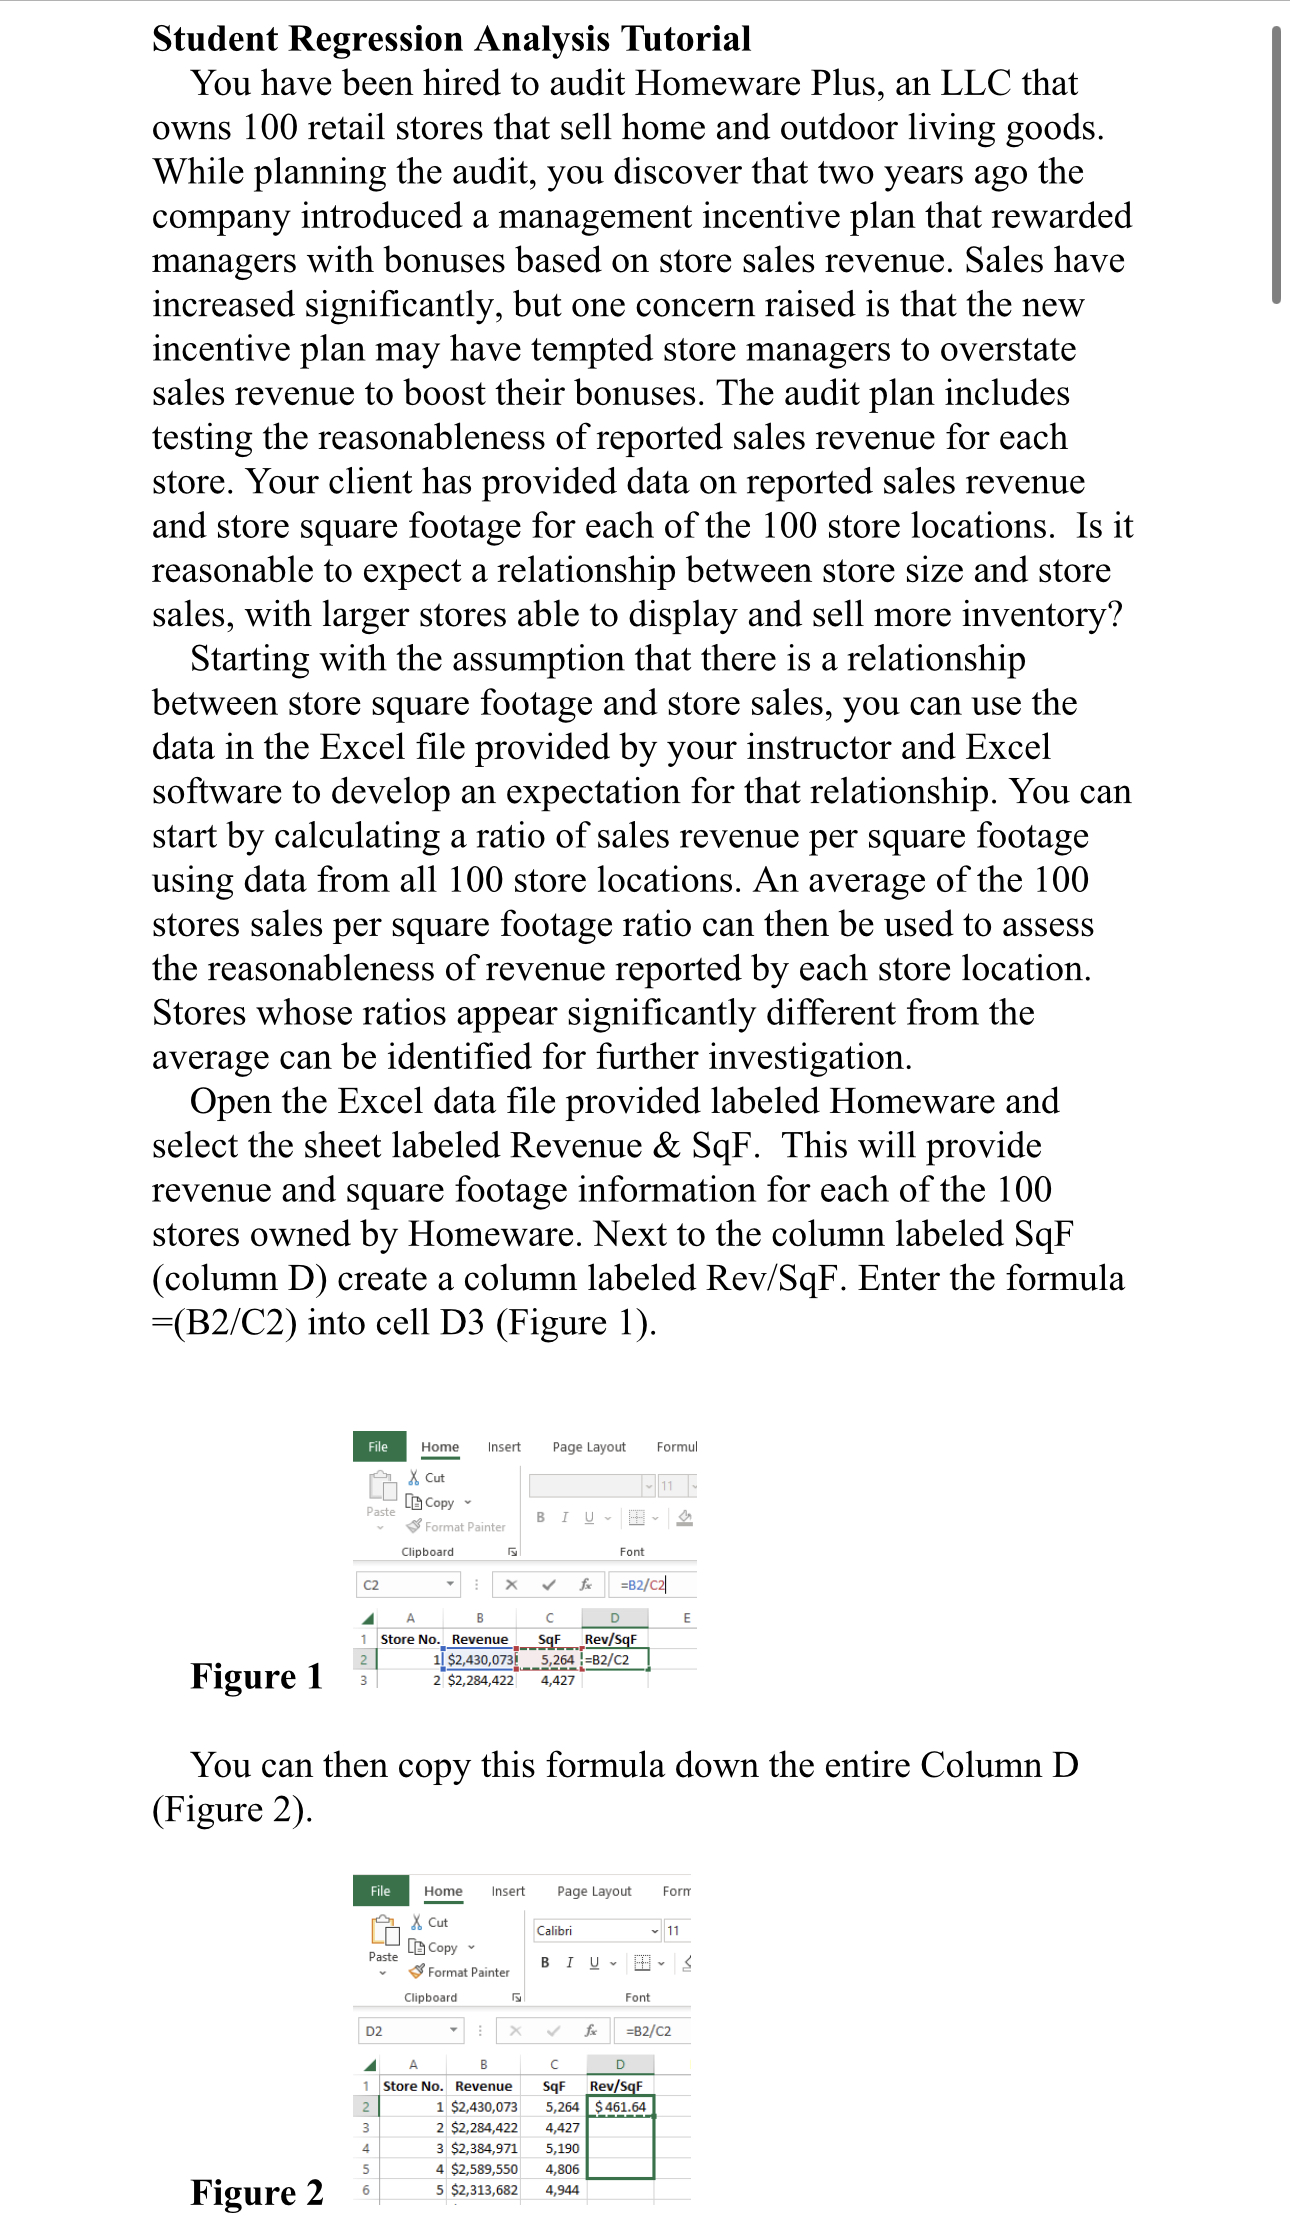
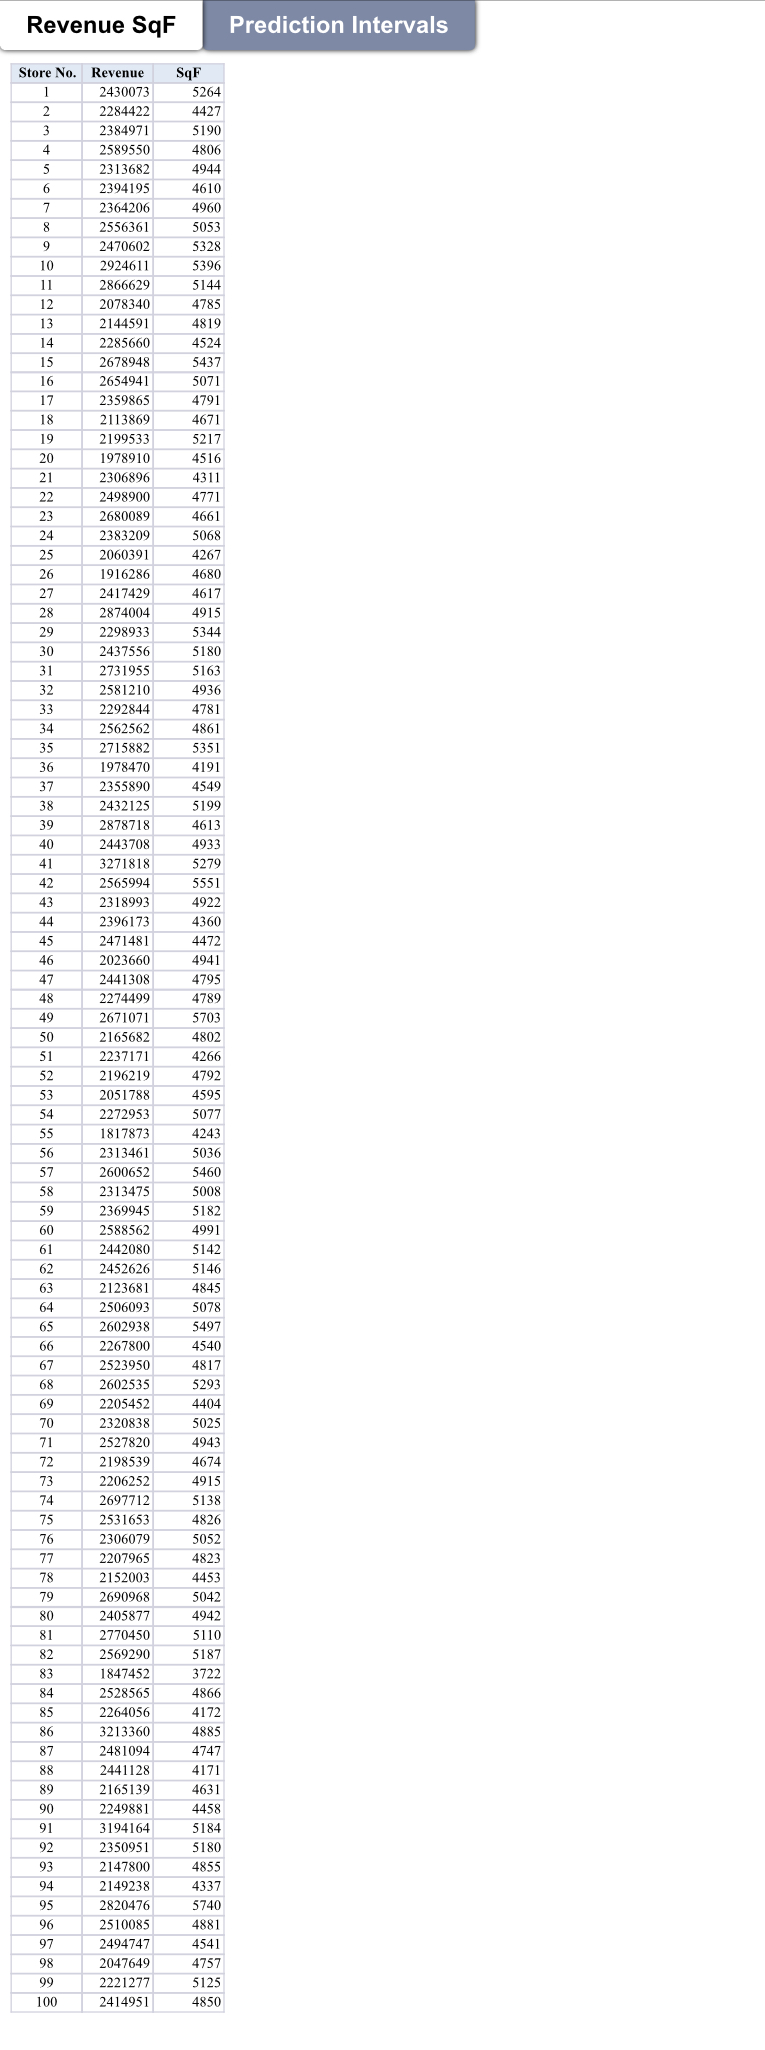
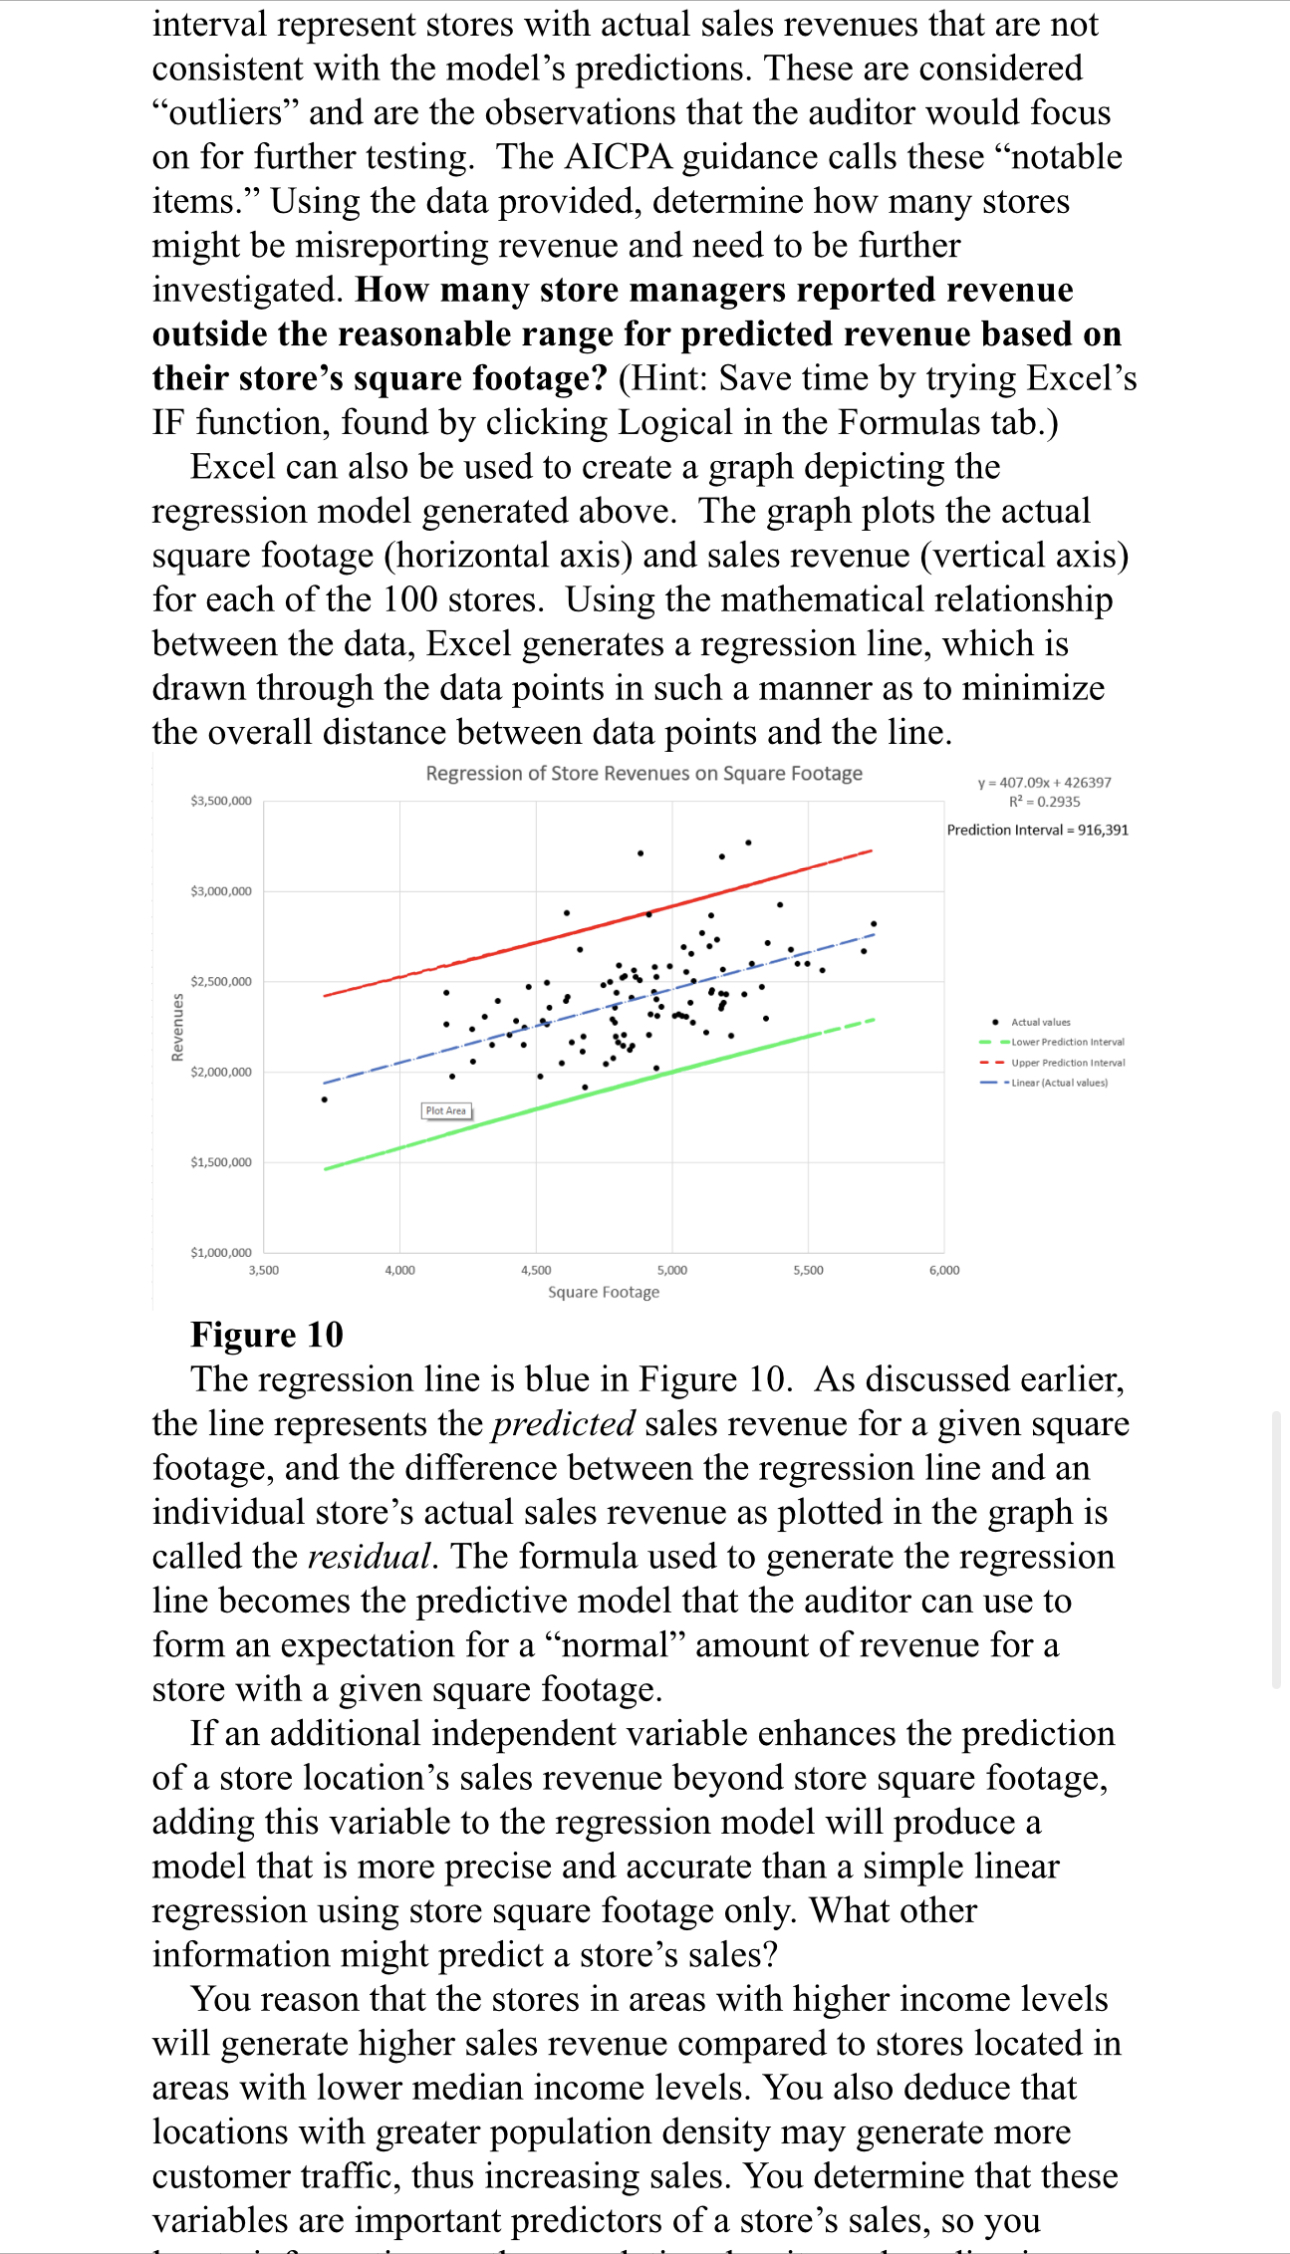
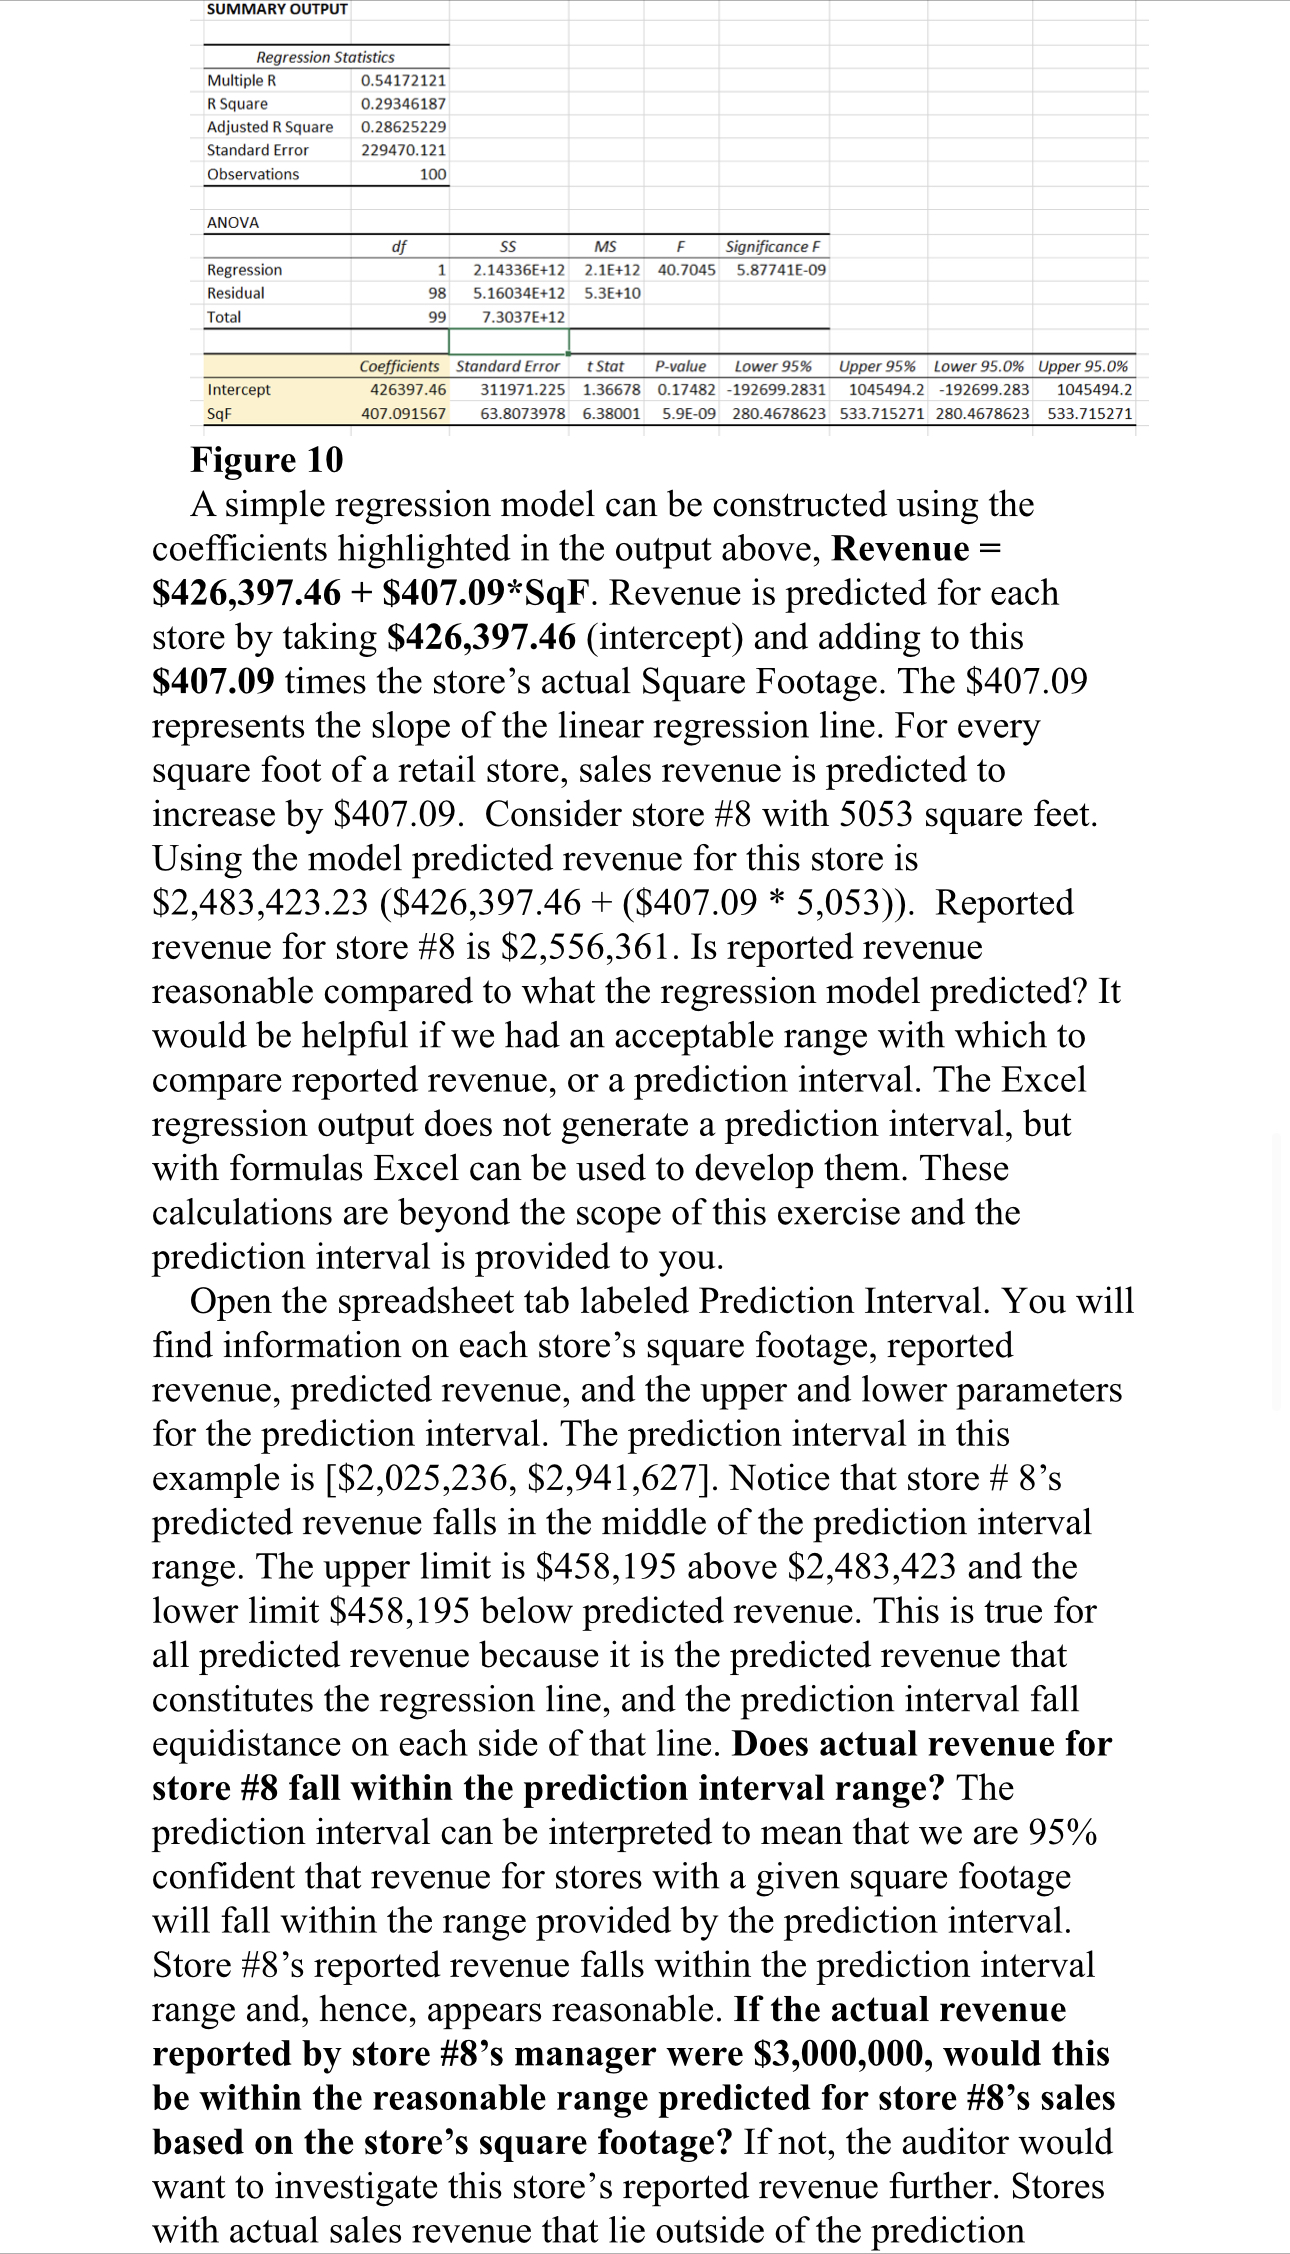
locate information on the population density and median income level of the surrounding area of each store. What other independent variables might be useful in predicting a store location's sales revenue? Excel does not have a multilinear tool, but you can use formulas in Excel to produce a multiple linear regression model. We provide a graph of the results of a multilinear regression for you in Figure 1]. Plot of Studentlred Residuals Sunlmuwmi Ros-climb. O 0 1,700,000 1,900,000 2,100,000 2,300,000 2,500,000 2,700,000 2300030 3,100,000 Predicted Sales Figure 11 A multiple linear regression model does not provide the line- based graph shown in Figure 2. Instead, the size of the residual produced is used to identify items for additional investigation. Recall that the residual is the difference between the actual observation (i.e., store sales revenue) and the expected value predicted by the regression model. In a multilinear regression this is referred to as the internally studentized residual for each observation produced. Internally studentized residuals are residuals that have been adjusted statistically to be comparable across different units of measurement. They are not as accurate in identifying outliers as externally studentized residuals but are the easiest to generate with Excel. The larger the internally studentized residual, the less that the sales revenue per store is predicted by the independent variables in the model. A general rule of thumb is to investigate observations with values smaller than -2 and greater than 2. The graph below plots the internally studentized residuals produced by the multiple linear regression. Are the number of stores that warrant further investigation by the simple linear regression corroborated? Improving Use of Data Analysis While statistical understanding and technical software skills are required to successfully implement data analysis in an audit, other \"soft skills\" are needed to effectively capitalize on the benefits of methods like regression: ' Understand the nature of causality, Individuals can often fall into the trap of data mining and simply nding random enter. File Home Insert Page Layout Formulas & Cut - 11 A Paste [ Copy Format Painter BIUT-MA Clipboard Font SUM 1 X v fx =D2-SD$102 Ratio Store No. Revenue SqF Rev/SqF Difference 2 26 $1,916,286 4,680 | $ 409.46 |=D2-SD$102 46 $2,023,660 4,941 $ 409.56 Figure 6 Once you have calculated the difference between the average ratio and the ratio for store 1, you will want to copy the formula down to determine the difference between that average and all 100 store ratios (Figure 7). 110 - 1 x V & Ratio Store No. Revenue SqF Rev/SqF Difference 26 $1,916,286 4,680 $ 409.46 $ (85.57) 46 $2,023,660 4,941 $ 409.56 $ (85.47) QUAWN 19 $2,199,533 5,217 $ 421.61 $ (73.42) 55 $1,817,873 4,243 $ 428.44 $ (66.59) 29 $2,298,933 5,344 $ 430.19 $ (64.84) 98 $2,047,649 4,757 $ 430.45 $ (64.58) 99 $2,221,277 5,125 $ 433.42 $ (61.61) 12 $2,078,340 4,785 $ 434.34 34 $ (60.69) 20 $1,978,910 4,516 $ 438.20 $ (56.83) Figure 7 What is the range of differences between a store's actual Rev/SqF ratio and the average for all 100 stores? Which store(s) demonstrate the greatest difference from the ratio average? As an auditor, are you more concerned about stores reporting below average revenue per square footage or above average revenue per square footage? Stores demonstrating the greatest difference between reported Rev/SqF and the average Rev/SqF warrant additional investigation. As you can see, comparing each store ratio with the average to determine whether there is a significant difference involves a high degree of subjective judgement. It can be difficult to determine the proper cutoff and exactly which stores are overreporting. A less subjective approach to assessing the reasonableness of a given store's reported sales revenue would be to apply regression analysis. A regression model predicts the changes in a dependent variable, the variable of interest the auditor wants to test or verify (sales revenue in this case), based on changes in selected independent variables, items which, in the auditor's judgment, should predict the dependent variable (square footage is the independent variable in this case). With the provided data and the Excel regression tool you can develop a prediction model that you can use to generate a predicted amount of revenue based on the actual square footage of a given store. The degree to which a store's reported revenue varies from the predicted revenue can help you identify high- risk stores where management may be falsifying reported revenue. An example of a simple linear model is Revenue = Intercept + *(SqF). This model may look familiar from your algebra days: y = mx + b. In our case, y is Revenue, x is SqF, mWhile statistical understanding and technical software skills are required to successfully implement data analysis in an audit, other \"soft skills\" are needed to effectively capitalize on the benefits of methods like regression: ' W31, Individuals can often fall into the trap of data mining and simply nding random correlations in the data (i.e., independent variables that appear to predict the dependent variable). There must be a theoretical causal relationship between the dependent and independent variables. come from outside the client. In other words, variables from the industry and economy may be more useful than measures produced by the client. Be creative! ' Be able to interpret data. In the real world, data is often not as clean and precise as textbook examples. An auditor needs to be able to recognize patterns in data that were not previously expected. Additionally, the auditor should be able to \"explain\" the data. Keep in mind that even if the output (standard error, etc.) suggests the model is well specied, the auditor should still challenge whether the model is correct. It is too easy to fall into the trap of simply letting the software do all the work. The regression calculations are a decision aid. They should not replace auditor judgment! Questions to be answered: 1. 2. What is the average Rev/SqF for all 100 stores? What is the range of differences between a store's actual average Rev/SqF ratio and the average for all 100 stores? . Which store(s) demonstrate the greatest difference from the ratio average? . As an auditor for Homeware, are you more concerned about stores reporting below average revenue per square footage or above average revenue per square footage? Why? . Does actual revenue for store #8 fall within the prediction interval range? . 1f the actual revenue reported by store #8's manager is $3,000,000, would this be within the reasonable range predicted for store #8'5 sales, based on the store's square footage? . How many store managers reported revenue outside the prediction interval based on their store's square footage? . What other independent variables might be useful in predicting a store location's sales revenue? . Are the number of stores that warrant further investigation by the simple linear regression corroborated with the multilinear regression? 10. What are two ways to improve the usefulness of data analysis? is the slope estimating the relationship between revenue and square footage, and b is the intercept. The intercept is also referred to as the constant and is where the regression line crosses the Y axis. You can think of the intercept as the average base revenue for stores before considering square footage. The B represents the slope of the linear regression line. For every square foot of a retail store, sales revenue is predicted to increase by B dollars. To generate the output you will use to construct your regression model, add a row above the column labels in the Excel spreadsheet. Use this top row to label the Revenue column as Y (dependent variable) and SqF Column as X (the independent variable). Comments Share Data Analysis Remove Data Consolidate Relationships Manage What-If Forecast Group Ungroup Subtotal uplicates Validation Data Model Analysis Data Tools Forecast Outline Analysis R w Z AA AB AC Data Analysis X Analysis Tools OK F-Test Two-Sample for Variances Fourier Analysis Cancel Histogram Moving Average Random Number Generation Help Rank and Percentile Sampling t-Test: Paired Two Sample for Means -Sample Assuming Equal Variances Figure 8 Click on the Data tab. In the upper far right-hand corner, you should see Data Analysis (If you do not, you will need to load the Analysis ToolPak https://support.microsoft.com/en- us/office/load-the-analysis-toolpak-in-excel-6a63e598-cd6d- 42e3-9317-6b40bala66b4) Click on Data Analysis, select Regression, and click OK (Figure 8). Regression Input OK Input Y Range: SBS2:$6$102 Cancel Input X Range: SC$2:SC$102 Labels Constant is Zero Help Confidence Level: 95 Output options Output Range: SGS3 O New Worksheet Ply. New Workbook Residuals Residuals Residual Plots Standardized Residuals Line Fit Plots Normal Probability Normal Probabil Figure 9 In the Regression box (Figure 9) select the Y Range which will be data in the Revenue Column ($B$2$B$102). This represents the variable that you are trying to predict (also called dependent variable). Then select the X Range which will be data in the SqF column ($C$2$C$102). This represents the explanatory variable (also called independent variable). In this case, it is the variable we are using to predict Revenue. Check Labels, Output Range (add $G$3 so that the output will start in this cell), and the then click OK. (Figure 9). The output will appear as shown in figure 10 starting in cell G3. SUMMARY OUTPUTCalculating an average for all 100 stores can help identify stores whose ratios are significantly different from the average. Click on the cell just below the Rev/SqF ratio for the last store in that column. Click the Formula tab and select Auto Sum. Choose Average from the dropdown menu. Click enter (Figure 3). File Home Insert Page Layout Formulas fx Z A @ Insert AutoSum Recently Financial Logical Text Date & Lool Function Used Time Refer Z Sum Function Library SUM Average =AVERAGE(D2:D101) 4 Count Numbers 94 Max $ 442.39 95 $ 495.56 96 Min $ 491.37 97 More Functions... $ 514.26 98 97 52,494,14/ 4,341 1 $ 549.38 99 98 $2,047,649 4,757 | $ 430.45 100 99 $2,221,277 5,125 | $ 433.42 101 100 $2,414,951 4,850 | $ 497.93 102 AVERAGE(D2:D101) Figure 3 What is the average Rev/SqF for all 100 stores? To make it easier to identify ratios that might be significantly different, you will need to sort your data. To sort the ratios in Column D from smallest to largest, select all columns in the spreadsheet through row 101. Next, click on Sort & Filter from the Home tab (Figure 4 ) . LUI E AY O Sort & Find & Analyze Filter ~ Select Data 24 Sort A to Z Al Sort Z to A 41 Custom Sort. Filter Figure 4 From the pulldown menu select Custom Sort. Sort on Rev/SqF from the first drop-down menu. Select smallest to largest in the last drop-down menu (Figure 5). File Home Insert Page Layout Formulas Data Review View Automate Help Acrobat & Cut Sort X Copy Paste Format Painter + Add Level X Delete Level [ Copy Level ~ ~ Options... My data has headers Clipboard Column Sort On Order nber Sort by Rev/SqF Cell Values v Smallest to Largest v A2 1 Store No. Revenue 1 $2,430,073 2 $2,284,422 3 $2,384,971 VOUI A W N 4 $2,589,550 OK Cancel 5 $2,313,682 407.30 6 $2,394,195 4,610 $ 519.35 Figure 5 Even after calculating an average Rev/SqF ratio and sorting the ratios, it may be difficult to simply eye the data and determine whether there are ratios significantly different from the average. To facilitate your assessment, you can take the difference between each store's ratio and the average. Label the column next to the Rev/SqF ratio "Ratio Difference." In cell E2 enter the formula =D2-$D$102. You want to fix the relationship of the cell containing the average ratio (D102) by placing dollar signs before and after the letter for that cell (Figure 6). ClickRevenue SqF Prediction Intervals Predicted Prediction Interval Store No. SqFt Revenues Revenues Lower Upper 5264 1347595 1444360.5 1279844 1608876.9 N 1326789 1307791.5 1142957 1472625.7 5190 1540957 1432286.3 1268094 1596479 4806 1421848 1369631 1206024 1533238.3 4944 1300680 1392147.7 1228542 1555753.3 4610 1374312 1337650.7 1173632 1501669.8 4960 1410719 1394758.4 1231138 1558379.1 5053 1414502 1409932.7 1246160 1573705.3 9 5328 1387578 1454803 1289952 1619653.7 10 5396 1488963 1465898.2 1300637 1631159.1 11 5144 1562289 1424780.7 1260755 1588806.3 12 4785 1221181 1366204.5 1202576 1529833 13 4819 1372222 1371752.1 1208155 1535349.1 14 4524 1281193 1323618.5 1159268 1487969.1 15 5437 1540752 1472588 1307053 1638123.3 16 5071 1450210 1412869.7 1249055 1576684.1 17 4791 1398859 1367183.5 1203562 1530805.4 18 4671 1358253 1347603.7 1183764 1511443.3 19 5217 1292246 1436691.7 1272389 1600994.7 20 4516 1278753 1322313.2 1157927 1486699.3 21 4311 1229172 1288864.4 1123301 1454427.8 22 4771 1403896 1363920.2 1200275 1527565.8 23 4661 1505189 1345972.1 1182106 1509837.9 24 5068 1351013 1412380.2 1248573 1576187.4 25 4267 1367365 1281685.1 1115802 1447567.8 26 4680 1249861 1349072.2 1185255 1512889.2 27 4617 1313091 1338792.8 1174797 1502789 28 4915 1651152 1387415.9 1223830 1551002.1 29 5344 1426394 1457413.7 1292472 1622355.8 30 5180 1419149 1430654.6 1266500 1594808.8 31 5163 1371646 1427880.8 1263789 1591972.3 32 4936 1471277 1390842.4 1227243 1554441.5 33 4781 1345811 1365551.9 1201919 1529185 34 4861 1340450 1378605 1215027 1542183.1 35 5351 1524385 1458555.8 1293573 1623538.9 36 4191 1154410 1269284.6 1102796 1435773.4 37 4549 1308499 1327697.6 1163453 1491942.4 38 5199 1398124 1433754.8 1269526 1597983.2 39 4613 1333243 1338140.2 1174131 1502149.3 40 4933 1580386 1390352.9 1226756 1553949.8 41 5279 1511027 1446807.9 1282218 1611398.2 42 5551 1430107 1491188.8 1324784 1657593.5 43 4922 1379732 1388558.1 1224968 1552147.9 44 4360 1348727 1296859.5 1131624 1462094.9 45 4472 1263181 1315133.9 1150538 1479729.4 46 4941 1238494 1391658.2 1228055 1555261.3 47 4795 1309531 1367836.2 1204218 1531453.9 48 4789 1344782 1366857.2 1203233 1530481.2 49 5703 1447735 1515989.8 1348186 1683793.8 50 4802 1221311 1368978.3 1205367 1532589.2 51 4266 1313025 1281522 1115632 1447412.2 52 4792 1340788 1367346.7 1203726 1530967.5 53 4595 1171133 54 1351628 1413848.6 1250019 1577678 55 4243 1230420 1277769.2 1111703 1443835.8 56 5036 1357412 1407158.9 1243422 1570895.7 57 5460 1343500 1476340.8 1310643 1642038.9 58 5008 1320406 1402590.3 1238905 1566275.9 59 5182 1477454 1430981 1266819 1595142.7 60 4991 1524434 1399816.5 1236157 1563475.8 61 5142 1406284 1424454.4 1260435 1588473.3 62 5146 1512418 1425107 1261075 1589139.4 63 4845 1384565 1375994.4 1212412 1539577 64 5078 1356294 1414011.8 1250180 1577843.6 65 5497 1588920 1482377.9 1316404 1648351.3 66 4540 1381662 1326229.1 1161947 1490511.2 67 4817 1402664 1371425.8 1207827 1535024.2 68 5293 1417474 1449092.2 1284431 1613753.9 69 4404 1311680 1304038.7 1139073 1469004.4 70 5025 1334421 1405364.1 1241649 1569079.6 71 4943 1352196 1391984.6 1228380 1555589.2 72 4674 1360779 1348093.2 1184261 1511925.2 73 4915 1346980 1387415.9 1223830 1551002.1 74 5138 1498456 1423801.7 1259796 1587807.5 75 4826 1413797 1372894.3 1209302 1536486.5 76 5052 1423646 1409769.5 1245999 1573539.9 77 4823 1410353 1372404.8 1208811 1535999 78 4453 1343103 1312033.8 1147341 1476727 79 5042 1452946 1408137.9 1244389 1571886.9 80 1652449 1391821.4 1228218 1555425.2 81 5110 1469746 1419233.1 1255314 1583152.1 82 5187 1405783 1431796.8 1267616 1595977.8 83 3722 1187328 1192760.3 1021048 1364473 84 4866 1278349 1379420.9 1215844 1542998.1 85 4172 1208819 1266184.5 1099533 1432835.5 86 4885 1291632 1382521 1218944 1546098.1 87 4747 1301106 1360004.3 1196323 1523685 88 4171 1465832 1266021.3 1099362 1432681 89 4631 1334234 1341077.1 1177125 1505029.2 90 4458 1250056 1312849.6 1148183 1477516.7 91 5184 1380345 1431307.3 1267138 1595476.7 92 5180 1501532 1430654.6 1266500 1594808.8 93 4855 1471629 1377626.1 1214047 1541205.4 94 4337 1332324 1293106.7 1127721 1458492.4 95 5740 1596705 1522026.9 1353841 1690212.4 96 1369542 1381868.3 1218292 1545445.1 97 4541 1279791 1326392.3 1162114 1490670.1 98 4757 1268773 1361635.9 1197971 1525301.2 99 5125 1337742 1421680.6 1257716 1585644.8 100 4850 1462911 1376810.2 1213229 1540391.1Student Regression Analysis Tutorial You have been hired to audit Homeware Plus, an LLC that owns 100 retail stores that sell home and outdoor living goods. While planning the audit, you discover that two years ago the company introduced a management incentive plan that rewarded managers with bonuses based on store sales revenue. Sales have increased significantly, but one concern raised is that the new incentive plan may have tempted store managers to overstate sales revenue to boost their bonuses. The audit plan includes testing the reasonableness of reported sales revenue for each store. Your client has provided data on reported sales revenue and store square footage for each of the 100 store locations. Is it reasonable to expect a relationship between store size and store sales, with larger stores able to display and sell more inventory? Starting with the assumption that there is a relationship between store square footage and store sales, you can use the data in the Excel file provided by your instructor and Excel software to develop an expectation for that relationship. You can start by calculating a ratio of sales revenue per square footage using data from all 100 store locations. An average of the 100 stores sales per square footage ratio can then be used to assess the reasonableness of revenue reported by each store location. Stores whose ratios appear significantly different from the average can be identified for further investigation. Open the Excel data file provided labeled Homeware and select the sheet labeled Revenue & SqF. This will provide revenue and square footage information for each of the 100 stores owned by Homeware. Next to the column labeled SqF (column D) create a column labeled Rev/SqF. Enter the formula =(B2/C2) into cell D3 (Figure 1). File Home Insert Page Layout Formul [ Copy Paste Format Painter BIU - - S Clipboard Font C2 IX V fx =B2/C2\\ A 1 Store No. Revenue SqF Rev/SqF Figure 1 2 1 $2,430,073 5,264 =B2/C2 3 2 $2,284,422 4,427 You can then copy this formula down the entire Column D (Figure 2). File Home Insert Page Layout Form & Cut Calibri 11 Paste [) Copy Format Painter Clipboard Font D2 1 X fix =B2/C2 A C D 1 Store No. Revenue SqF Rev/SqF 2 1 $2,430,073 5,264 $ 461.64 A W 2 $2,284,422 4,427 3 $2,384,971 5,190 4 $2,589,550 4,806 Figure 2 5 $2,313,682 4,944\finterval represent stores with actual sales revenues that are not consistent with the model's predictions. These are considered \"outliers\" and are the observations that the auditor would focus on for further testing. The AICPA guidance calls these \"notable items.\" Using the data provided, determine how many stores might be misreporting revenue and need to be further investigated. How many store managers reported revenue outside the reasonable range for predicted revenue based on their store's square footage? (Hint: Save time by trying Excel's IF function, found by clicking Logical in the Formulas tab.) Excel can also be used to create a graph depicting the regression model generated above. The graph plots the actual square footage (horizontal axis) and sales revenue (vertical axis) for each of the 100 stores. Using the mathematical relationship between the data, Excel generates a regression line, which is drawn through the data points in such a manner as to minimize the overall distance between data points and the line. Regressmn 0i Store Revenues 0n Square Footage V din/rm . MM\SUMMARY OUTPUT Regression Statistics Multiple 054172121 R Square 029346187 Adjusted R Square 0 23625229 Standard Error 229470.121 Observations 100 ANOVA _ _ df _ . SE. _ MS __ F _I_Sig-r_nfimnteF Regression 1 7.14335H1? 71\"\" 40.7045 smurf-09 Residual 98 5 15034E+12 5 SEN Total 99 7.3037Etll | J Coefficients Mandardtncr (Sta! PruaIue Lower 95% Upper 95% Lower 95.0% upperysoaa Intercept 426397.46 311971.225 1.36678 0.17432 71926992831 10454942 {192699283 10454942 Sql' 407091567 63 8073978 6.38001 EQEVOQ 2804678623 533.715271 2804678623 533715271 Figure 10 A simple regression model can be constructed using the coefcients highlighted in the output above, Revenue = $426,397.46 + $407 .09*SqF. Revenue is predicted for each store by taking $426,397.46 (intercept) and adding to this $407.09 times the store's actual Square Footage. The $407.09 represents the slope of the linear regression line. For every square foot of a retail store, sales revenue is predicted to increase by $407.09. Consider store #8 with 5053 square feet. Using the model predicted revenue for this store is $2,483,423.23 ($426,397.46 + ($407.09 * 5,053)). Reported revenue for store #8 is $2,556,361. Is reported revenue reasonable compared to what the regression model predicted? It would be helpful if we had an acceptable range with which to compare reported revenue, or a prediction interval. The Excel regression output does not generate a prediction interval, but with formulas Excel can be used to develop them. These calculations are beyond the scope of this exercise and the prediction interval is provided to you. Open the spreadsheet tab labeled Prediction Interval. You will nd information on each store's square footage, reported revenue, predicted revenue, and the upper and lower parameters for the prediction interval. The prediction interval in this example is [$2,025,236, $2,941,627]. Notice that store # 8's predicted revenue falls in the middle of the prediction interval range. The upper limit is $458,195 above $2,483,423 and the lower limit $458,195 below predicted revenue. This is true for all predicted revenue because it is the predicted revenue that constitutes the regression line, and the prediction interval fall equidistance on each side of that line. Does actual revenue for store #8 fall within the prediction interval range? The prediction interval can be interpreted to mean that we are 95% condent that revenue for stores with a given square footage will fall within the range provided by the prediction interval. Store #8's reported revenue falls within the prediction interval range and, hence, appears reasonable. If the actual revenue reported by store #8'5 manager were $3,000,000, would this be within the reasonable range predicted for store #8's sales based on the store's square footage? If not, the auditor would want to investigate this store's reported revenue further. Stores with actual sales revenue that lie outside of the prediction
Step by Step Solution
There are 3 Steps involved in it
1 Expert Approved Answer
Step: 1 Unlock
Question Has Been Solved by an Expert!
Get step-by-step solutions from verified subject matter experts
Step: 2 Unlock
Step: 3 Unlock
Students Have Also Explored These Related Accounting Questions!