

Question: Please use the EXCEL FILE ONLY to solve the question. Pleasure if you show the process! 5. Suppose that you are comparing the following two
Please use the EXCEL FILE ONLY to solve the question. Pleasure if you show the process!
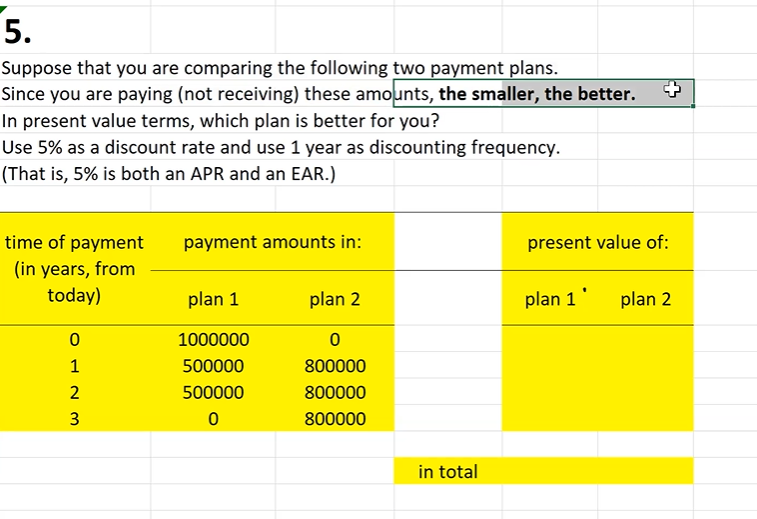
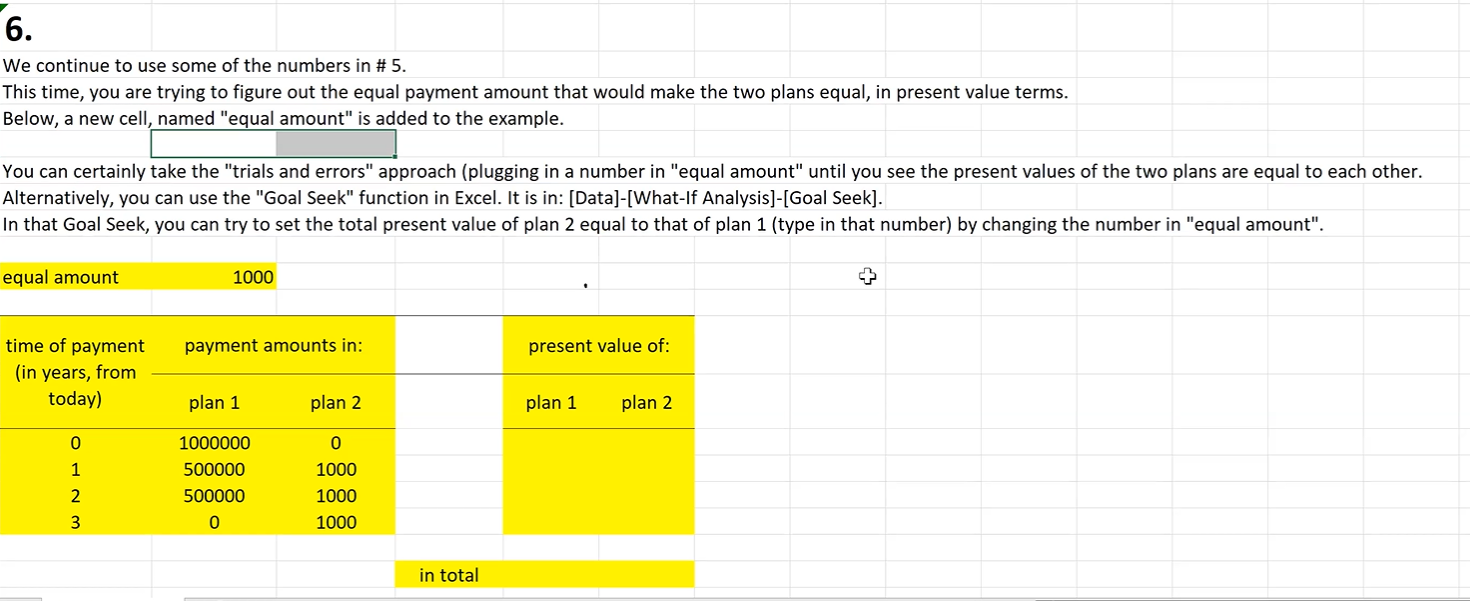
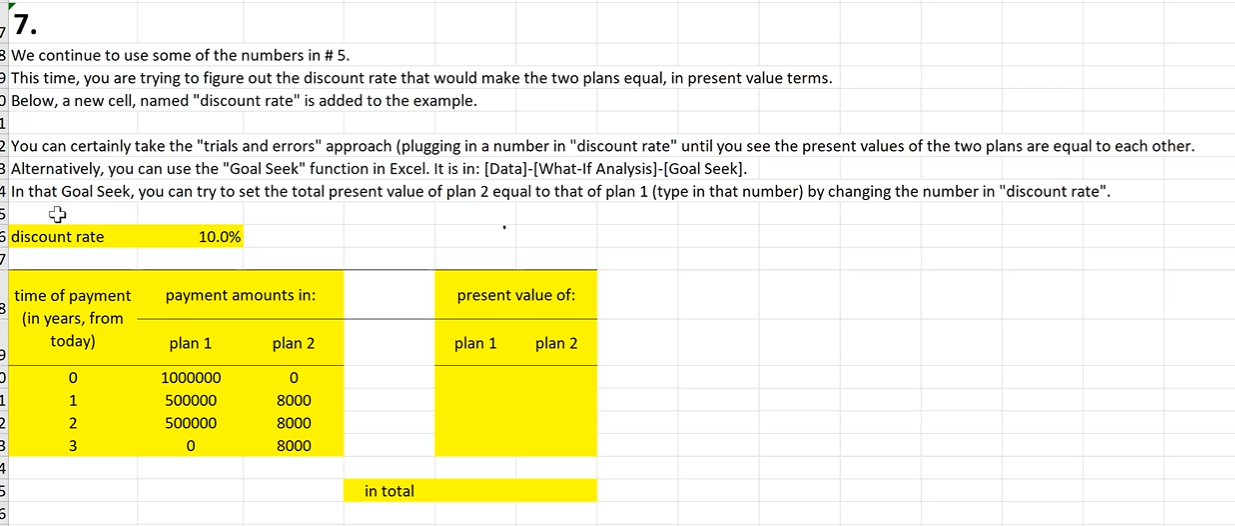
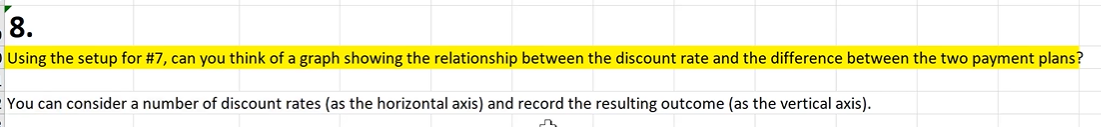
5. Suppose that you are comparing the following two payment plans. Since you are paying (not receiving) these amounts, the smaller, the better. In present value terms, which plan is better for you? Use 5% as a discount rate and use 1 year as discounting frequency. (That is, 5% is both an APR and an EAR.) \begin{tabular}{cccc} time of payment & payment amounts in: & present value of: \\ \cline { 2 - 4 } (in years, from & plan 2 & \\ \hline 0 & plan 1 & 0 \\ 1 & 1000000 & 800000 \\ 2 & 500000 & 800000 \\ 3 & 500000 & 800000 \end{tabular} in total We continue to use some of the numbers in \# 5 . This time, you are trying to figure out the equal payment amount that would make the two plans equal, in present value terms. Below, a new cell. named "eaual amount" is added to the example. You can certainly take the "trials and errors" approach (plugging in a number in "equal amount" until you see the present values of the two plans are equal the Alternatively, you can use the "Goal Seek" function in Excel. It is in: [Data]-[What-If Analysis]-[Goal Seek]. In that Goal Seek, you can try to set the total present value of plan 2 equal to that of plan 1 (type in that number) by changing the number in "equal amount". You can certainly take the "trials and errors" approach (plugging in a number in "discount rate" until you see the present values of the two plans are equal to each other. Alternatively, you can use the "Goal Seek" function in Excel. It is in: [Data]-[What-If Analysis]-[Goal Seek]. In that Goal Seek, you can try to set the total present value of plan 2 equal to that of plan 1 (type in that number) by changing the number in "discount rate". Using the setup for \#7, can you think of a graph showing the relationship between the discount rate and the difference between the two payment plans? You can consider a number of discount rates (as the horizontal axis) and record the resulting outcome (as the vertical axis). 5. Suppose that you are comparing the following two payment plans. Since you are paying (not receiving) these amounts, the smaller, the better. In present value terms, which plan is better for you? Use 5% as a discount rate and use 1 year as discounting frequency. (That is, 5% is both an APR and an EAR.) \begin{tabular}{cccc} time of payment & payment amounts in: & present value of: \\ \cline { 2 - 4 } (in years, from & plan 2 & \\ \hline 0 & plan 1 & 0 \\ 1 & 1000000 & 800000 \\ 2 & 500000 & 800000 \\ 3 & 500000 & 800000 \end{tabular} in total We continue to use some of the numbers in \# 5 . This time, you are trying to figure out the equal payment amount that would make the two plans equal, in present value terms. Below, a new cell. named "eaual amount" is added to the example. You can certainly take the "trials and errors" approach (plugging in a number in "equal amount" until you see the present values of the two plans are equal the Alternatively, you can use the "Goal Seek" function in Excel. It is in: [Data]-[What-If Analysis]-[Goal Seek]. In that Goal Seek, you can try to set the total present value of plan 2 equal to that of plan 1 (type in that number) by changing the number in "equal amount". You can certainly take the "trials and errors" approach (plugging in a number in "discount rate" until you see the present values of the two plans are equal to each other. Alternatively, you can use the "Goal Seek" function in Excel. It is in: [Data]-[What-If Analysis]-[Goal Seek]. In that Goal Seek, you can try to set the total present value of plan 2 equal to that of plan 1 (type in that number) by changing the number in "discount rate". Using the setup for \#7, can you think of a graph showing the relationship between the discount rate and the difference between the two payment plans? You can consider a number of discount rates (as the horizontal axis) and record the resulting outcome (as the vertical axis)
Step by Step Solution
There are 3 Steps involved in it

Get step-by-step solutions from verified subject matter experts