

Question: please use the excel sheet to answer Using Scenarios and Data Tables to Support Pricing Decisions The Istanbul Water Company ( ISKI ) has used
please use the excel sheet to answer
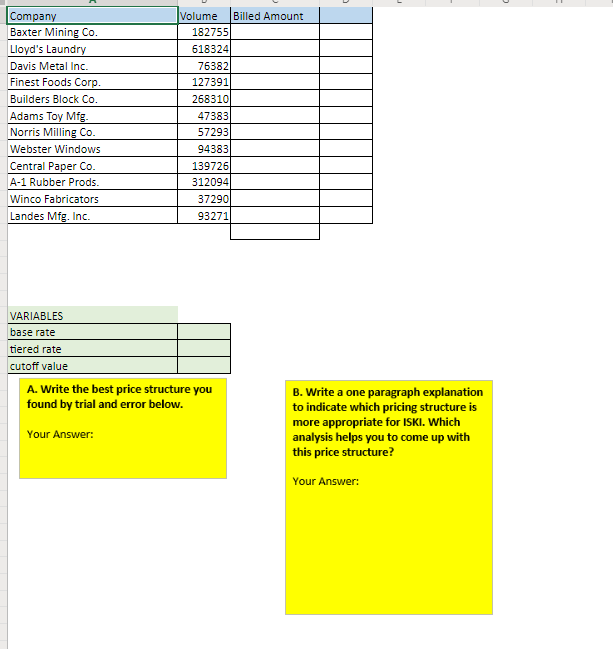
Using Scenarios and Data Tables to Support Pricing Decisions The Istanbul Water Company ( ISKI ) has used a two - tier price structure for its industrial customers which was designed to encourage water usage . Industrial customers have paid 9 cents a gallon for the first 100,000 gallons used each month , and 7 cents per gallon for each gallon beyond the first 100,000 . Because of a water shortage in the area , and increasing consumer pressure , ISKI is planning to change its rate structure to one that encourages water conservation . The plan is to retain the two - tier pricing structure , but reverse the tiers so that a higher rate is paid for gallons used beyond some cutoff level For example , the rates might simply be reversed so that customers would be charged 7 cents a gallon for the first 100,000 gallons and 9 cents a gallon for all additional gallons . Another possible rate structure might be cents a gallon for the first 50,000 gallons and 9.5 cents for all additional gallons . The new rate structure should produce approximately the same revenue as the previous structure . It is important for ISKI to know how the new rate structure affects individual industrial customers , since opposition can be expected from any customers whose water costs are substantially increased . ISKI has asked us to create a spreadsheet model which will allow the analysis of the impact of alternative rates and cutoff levels . 6 Although the price changes are designed to reduce water use ISKI does not have a good estimate of how much reduction will occur . Therefore , for the purpose of this spreadsheet analysis , we will assume that the number of gallons used by each customer is unaffected by the changes in the rate structure.For the current rate structure ( bree rate 50.00 / gallon , cutoff at 100,000 gallon , and $ 0.07 / gallo thereafter ) Enter the data into the worksheet ( 0.09 , 0.07 , 100000 ) in B20.B22 . Develop the fomulls that will compute the amount due by a customer , referring to the cells that contain the data . Enter the formula for Baxter in 02. Always use cell references in your formula favold typing in values ) . Use absolute referencing whenever required . Once you are sure your formula is correct , copy it downwards to cover all customers . Prepare a wow that will compute the total for all customers 3. Repeat this procedure with a rate structure that you propose . By trial and error , try to find a rate strueture that will meet the objectives stated in the case . At this point , you may find it useful to create new column that compute tbe clifferences between the current rate structure and proposed rate structure . Write the best price structure you found at this stage in box A Using Scenarios : A Scenario for us in this example ofits of linee " variables the base rate , the cutofl amount . and the tiened rate , as these are the things under our control . We can define scenaris in Excel pointing cul cells that are allowed to take different values and helps formalize our what - if analysis A resnio is identified by a scenario name that you specify . 1. Under Data memu go to What If analysis , and then choose Scenario Mannger . Choose Adki 2 Call the scenario you are about to define " current " Onder changing cells , give the address of the thired cells that you have used to experiment in the previous exercise ( for base rate , tiered rate and citott value ) 3. Eoter the default values for these cells 14. Create a new smarles , for instance ' high ' that has a rate of SD . 10 / gallon , a cate amount of 50.000 gallons and is tied rate of $ 0.12 / gallon 6. Under Sonario Nanager.cco a scenario and click on Display No that scenarios are permanent unless you delete them . This gives you a more systematic way of doing what if analysis compared to frasfom tria lanchetron You can also onerate summary reports of scontos !reports of scenarios . Using Data Tables : Another systematic way of analyzing the effects of a change in one or two variables in using data tables 1. Develop a one - variable data table that studies the effect of the change in the cutoff amount ( sallons ) on the change in the amount billed for all customers . We will develop tumw - oriented one varinble data table starting at cell 11 . Formulas and in a che variable data table most refer to an input cell . Our input cell will be the cell that both the clitol at B22 ) 1. Enter a list of five distinct vadiles you want to try for cutoff value acos 14 row . starting at ISO 100,00 , 100,000 . :) 2. Typ the formula that competes Baxtar's bill all the column to the left of the first value and one I below the row of values ( 12 ) When entering the formula is the cell address that houses the original cutoll value ( B22 ) Enter or copy ) the formulas for the other companies in the first format 3. Select the range of cells that contains the formules and values you want to substitute . 11 ... N13 . 2 on the Date menu fiad What I Amlysis and choose Data Table In the Rowlinpus bell toxicoter B22 Click OnLOR Now di computed a table that lists die effects of changes in cut - off value on He is onssamer . Write graph explanation to indicate which pricing structure is mon LTSR box B.
Step by Step Solution
There are 3 Steps involved in it

Get step-by-step solutions from verified subject matter experts