

Question: Please use the first image to solve: Management at The Deluxe Diner is establishing a quality control system for the time it takes to greet
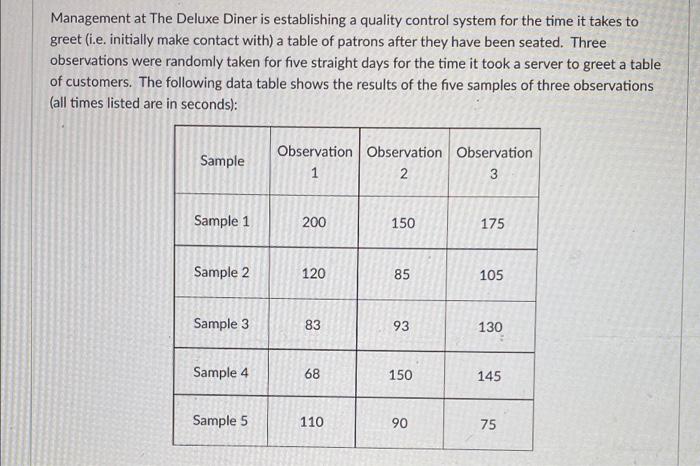
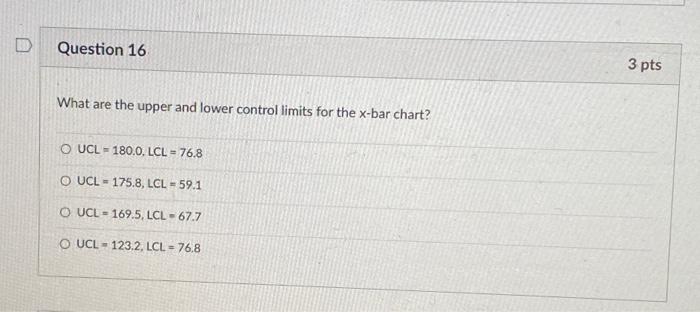
Management at The Deluxe Diner is establishing a quality control system for the time it takes to greet (i.e. initially make contact with) a table of patrons after they have been seated. Three observations were randomly taken for five straight days for the time it took a server to greet a table of customers. The following data table shows the results of the five samples of three observations (all times listed are in seconds): Sample Observation Observation Observation 1 2 3 Sample 1 200 150 175 Sample 2 120 85 105 Sample 3 83 93 130 Sample 4 68 150 145 Sample 5 110 90 75 Question 16 3 pts What are the upper and lower control limits for the x-bar chart? O UCL - 180.0, LCL = 76.8 O UCL - 175.8, LCL - 59.1 O UCL - 169.5, LCL - 67.7 O UCL - 123.2, LCL = 76.8
Step by Step Solution
There are 3 Steps involved in it

Get step-by-step solutions from verified subject matter experts