

Question: Please use the first two pages as reference for chart MATERIALS Stock solution of food Dye at 5000ppm. Choose Red, Blue or Yellow Diluent -
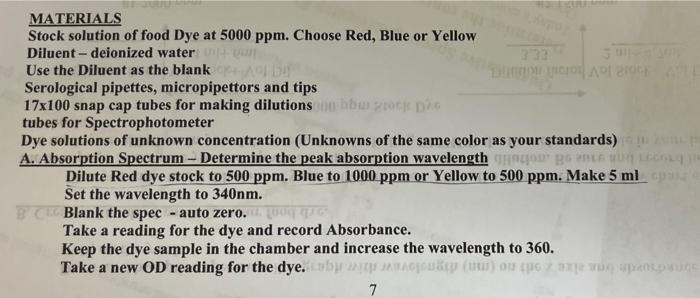
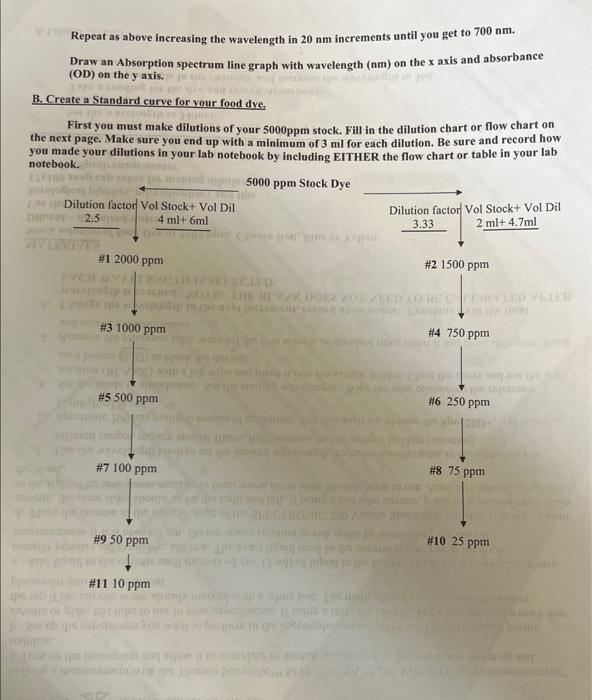
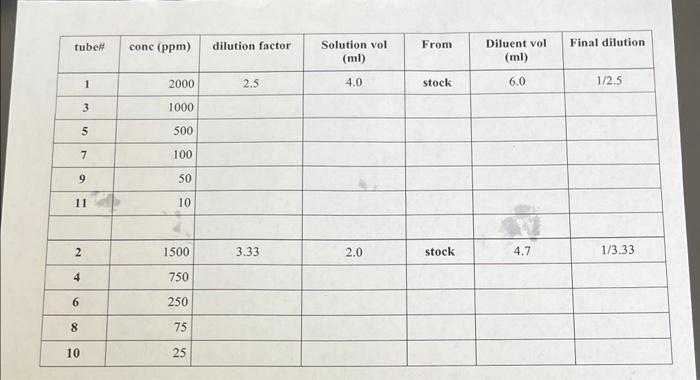
MATERIALS Stock solution of food Dye at 5000ppm. Choose Red, Blue or Yellow Diluent - deionized water Use the Diluent as the blank Serological pipettes, micropipettors and tips 17100 snap cap tubes for making dilutions tubes for Spectrophotometer Dye solutions of unknown concentration (Unknowns of the same color as your standards) A. Absorption Spectrum - Determine the peak absorption wavelength Dilute Red dye stock to 500ppm. Blue to 1000ppm or Yellow to 500ppm. Make 5ml Set the wavelength to 340nm. Blank the spec - auto zero. Take a reading for the dye and record Absorbance. Keep the dye sample in the chamber and increase the wavelength to 360 . Take a new OD reading for the dye. Repeat as above increasing the wavelength in 20nm increments until you get to 700nm. Draw an Absorption spectrum line graph with wavelength (nm) on the x axis and absorbance (OD) on the y axis. B. Create a Standard curve for your food dye. First you must make dilutions of your 5000ppm stock. Fill in the dilution chart or flow chart on the next page. Make sure you end up with a minimum of 3ml for each dilution. Be sure and record how \begin{tabular}{|c|r|c|c|c|c|c|} \hline tubeH & conc (ppm) & dilution factor & Solutionvol(ml) & From & Diluentvol(ml) & Final dilution \\ \hline 1 & 2000 & 2.5 & 4.0 & stock & 6.0 & 1/2.5 \\ \hline 3 & 1000 & & & & & \\ \hline 5 & 500 & & & & & \\ \hline 7 & 100 & & & & & \\ \hline 9 & 50 & & & & & \\ \hline 11 & 10 & & & & & \\ \hline & 1500 & 3.33 & 2.0 & stock & 4.7 & 1/3.33 \\ \hline 2 & 750 & & & & & \\ \hline 4 & 250 & & & & & \\ \hline 6 & 75 & & & & & \\ \hline 8 & 25 & & & & & \\ \hline 10 & & & & & & \\ \hline \end{tabular}
Step by Step Solution
There are 3 Steps involved in it

Get step-by-step solutions from verified subject matter experts