

Question: Please use the given Tableau charts and statistics to identify donor segments based on demographics (age, income) and participation in cause-marketing efforts.Analyze the given Tableau
Please use the given Tableau charts and statistics to identify donor segments based on demographics (age, income) and participation in cause-marketing efforts.Analyze the given Tableau charts and statistics and submit your interpretations and conclusion. These charts are based on a retailer'sCause-Marketing Donors for a Retail Firm.
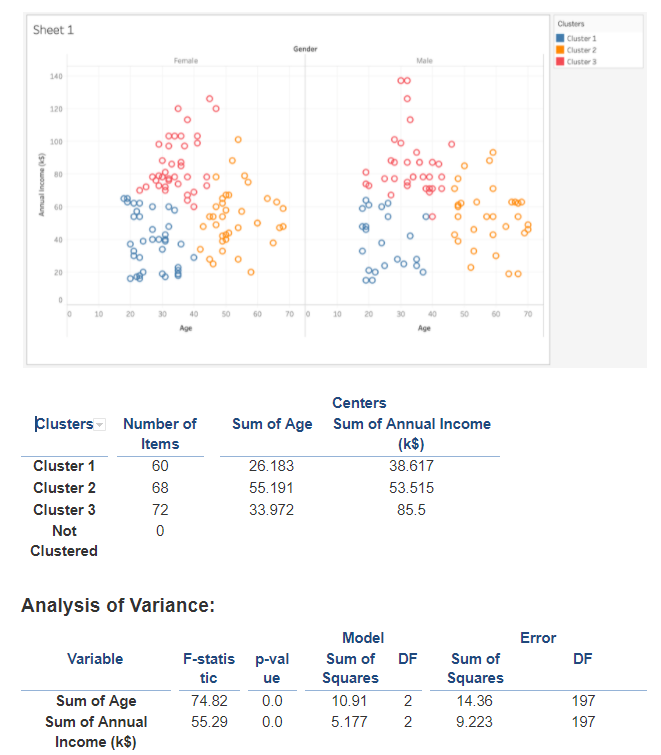
Chutter Sheet 1 Cluster 1 Gender Cluster 2 Female Male Cluster 3 140 120 O 000 100 00 0 O OO 10 0 0 O 00 O Annual Income ($] O 60 100 10 O 20 150 60 20 40 50 60 Age Centers Clusters - Number of Sum of Age Sum of Annual Income Items (k$) Cluster 1 60 26.183 38.617 Cluster 2 68 55. 191 53.515 Cluster 3 72 33.972 85.5 Not 0 Clustered Analysis of Variance: Model Error Variable F-statis p-val Sum of DF Sum of DF tic ue Squares Squares Sum of Age 74.82 0.0 10.91 14.36 197 Sum of Annual 55.29 0.0 5.177 2 9.223 197 Income (k$)
Step by Step Solution
There are 3 Steps involved in it

Get step-by-step solutions from verified subject matter experts