Question: Please use the provided data on excel thx! ( 3 pts. total; 1 pt. per item) Calculate It #1 - You prepare a series of
Please use the provided data on excel thx!
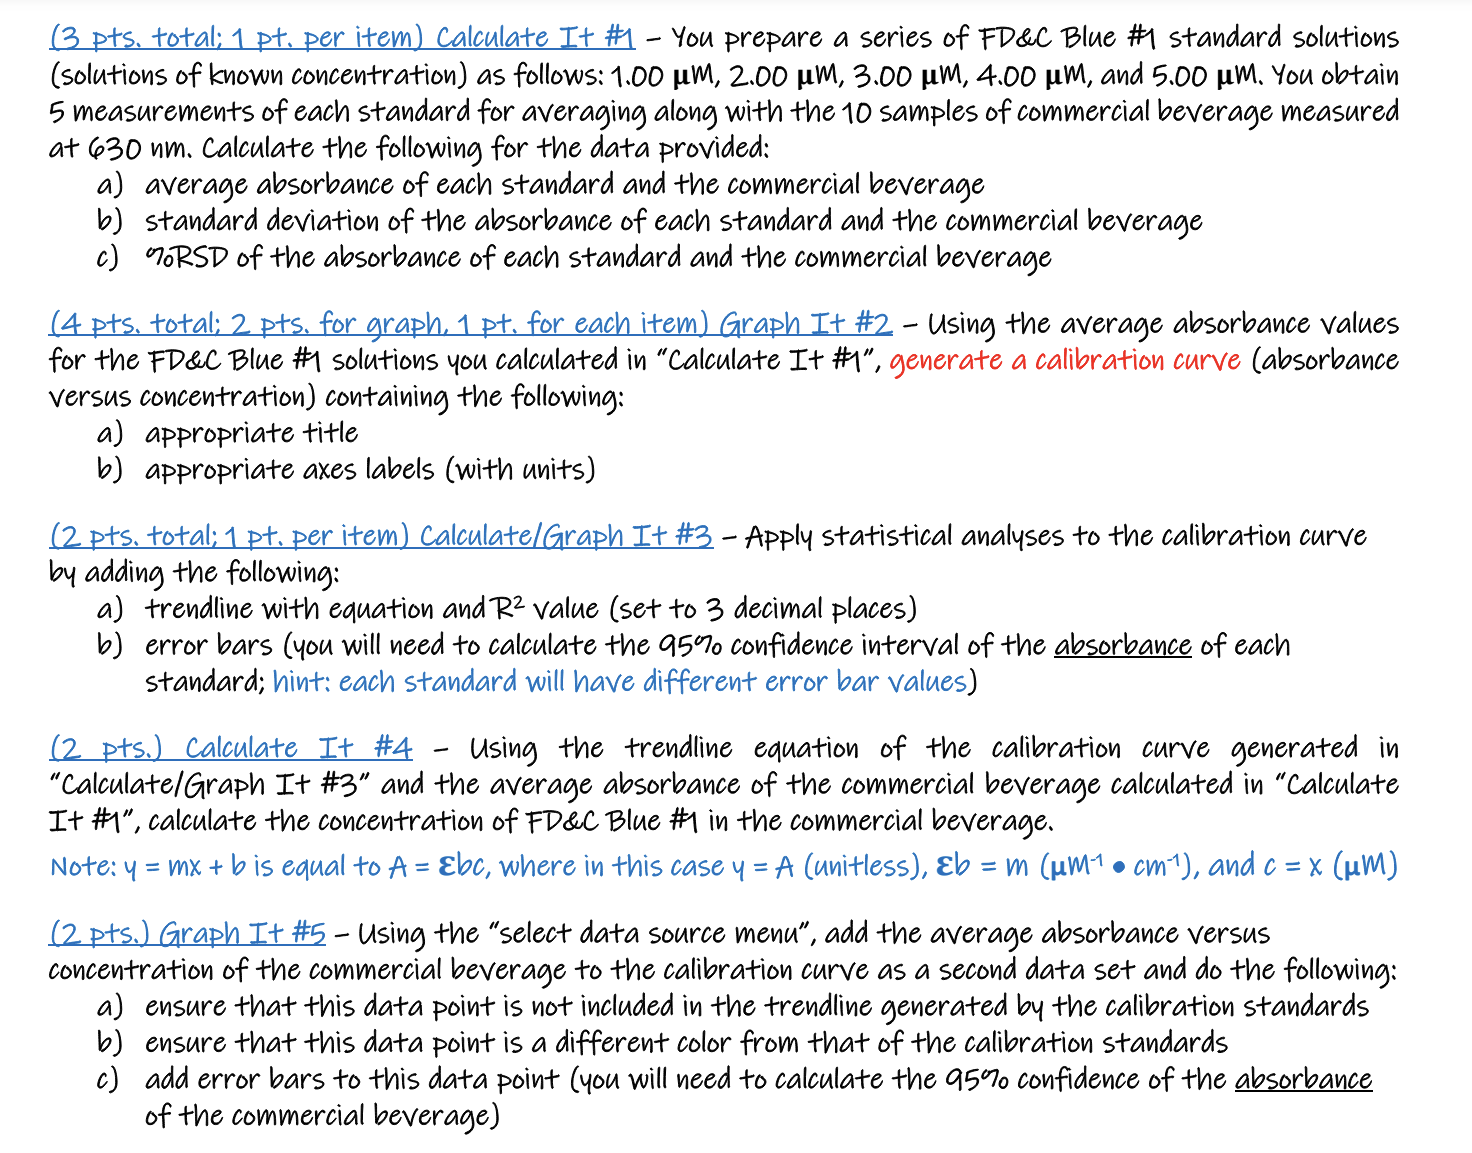
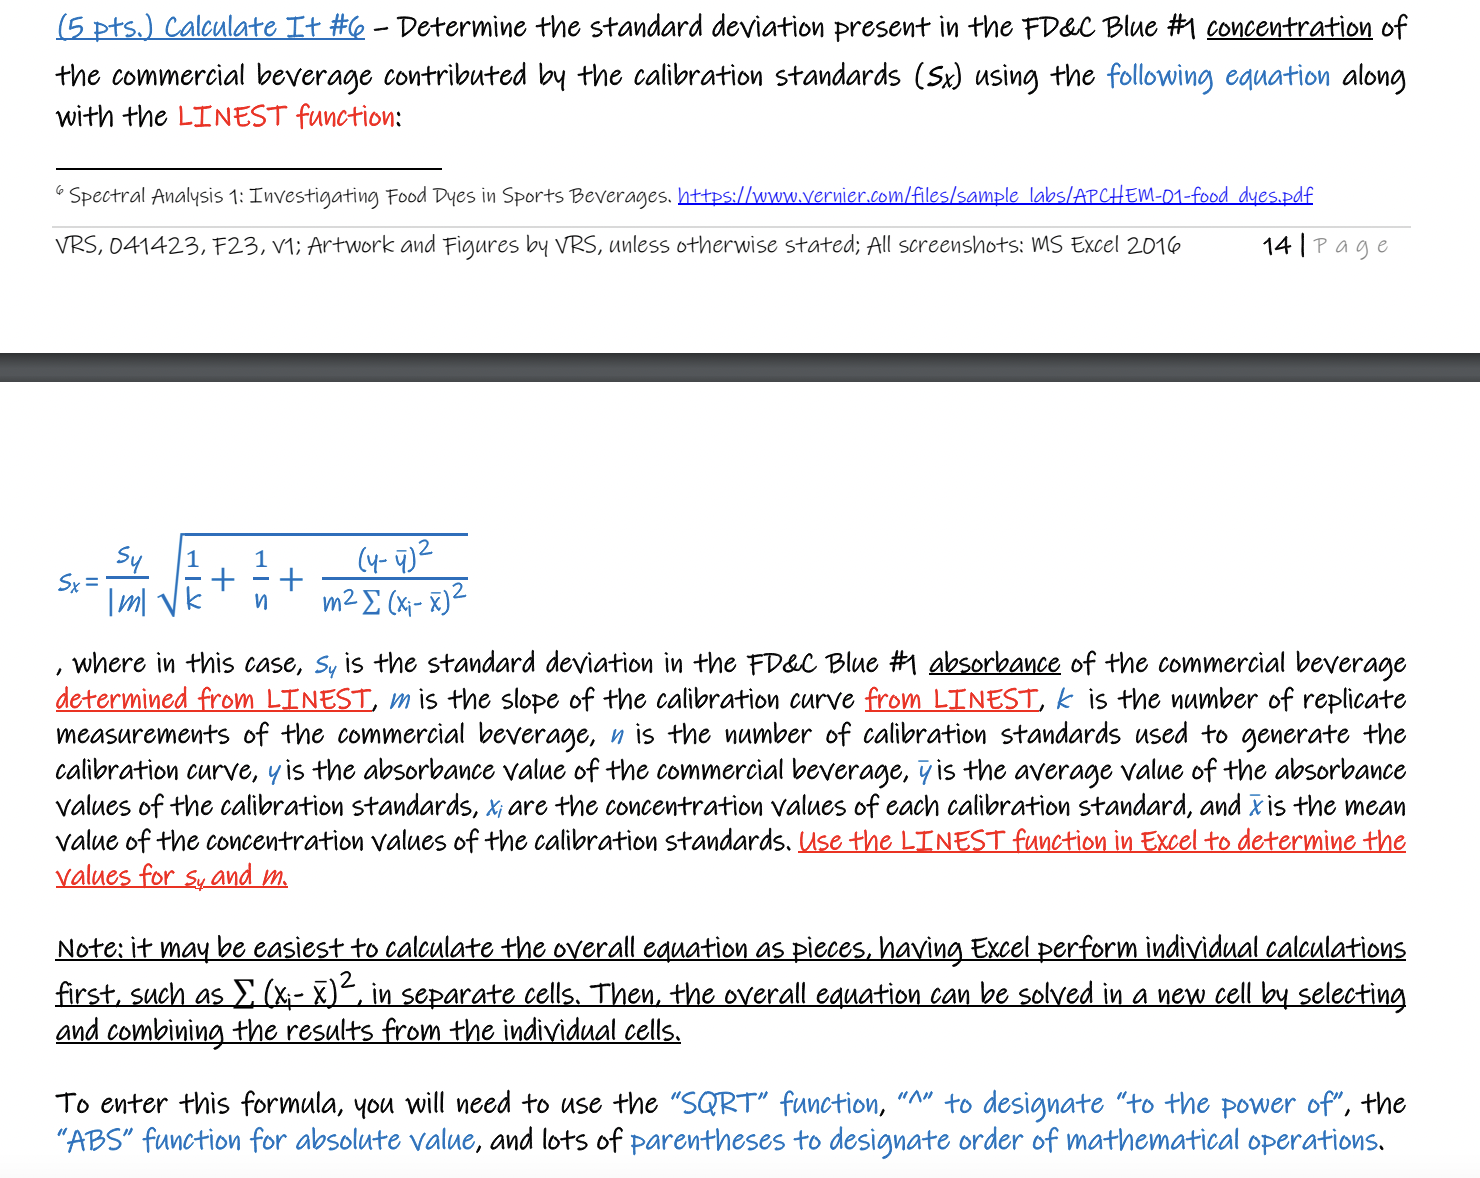
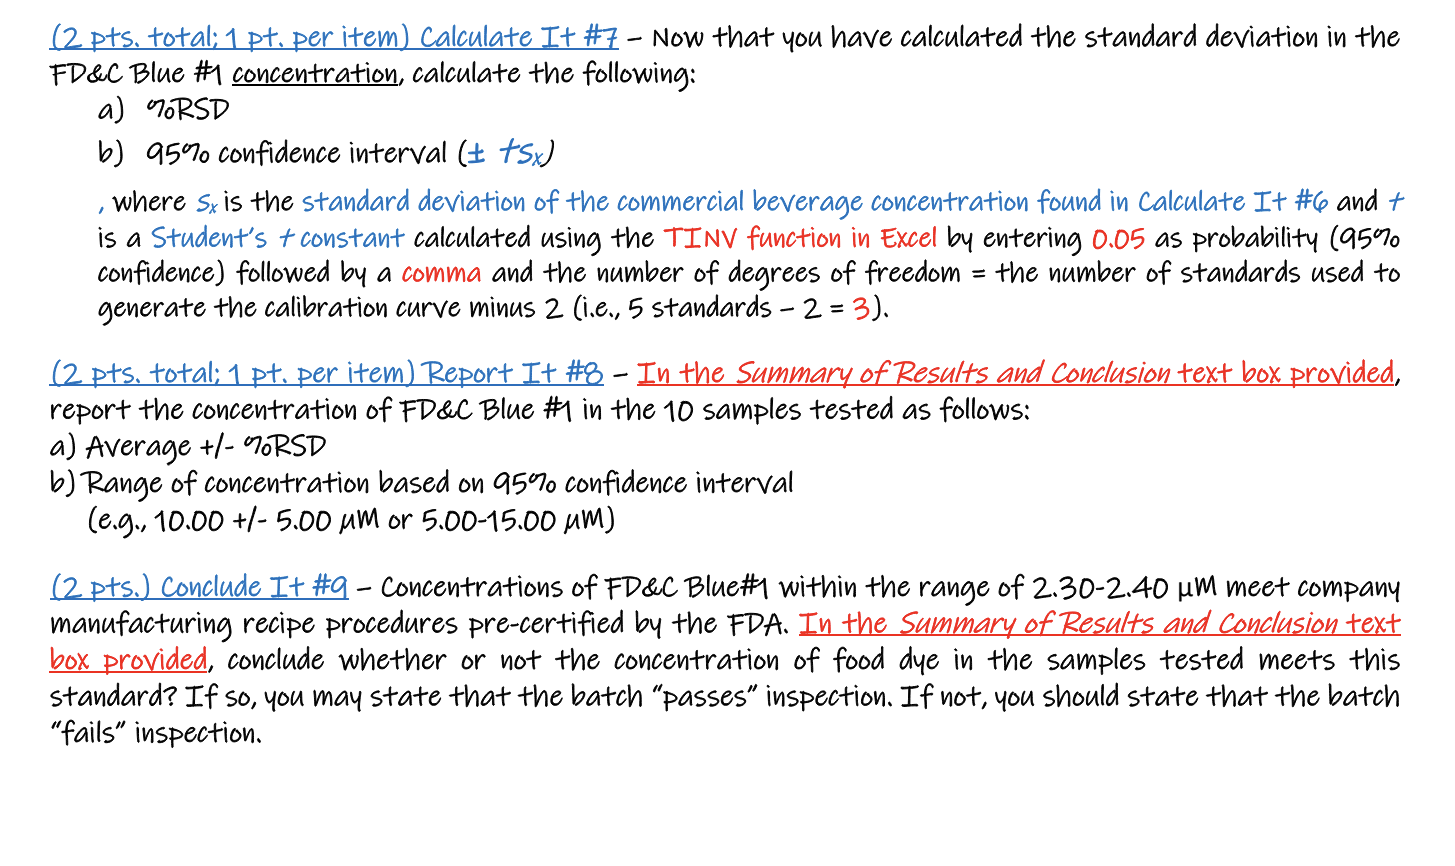
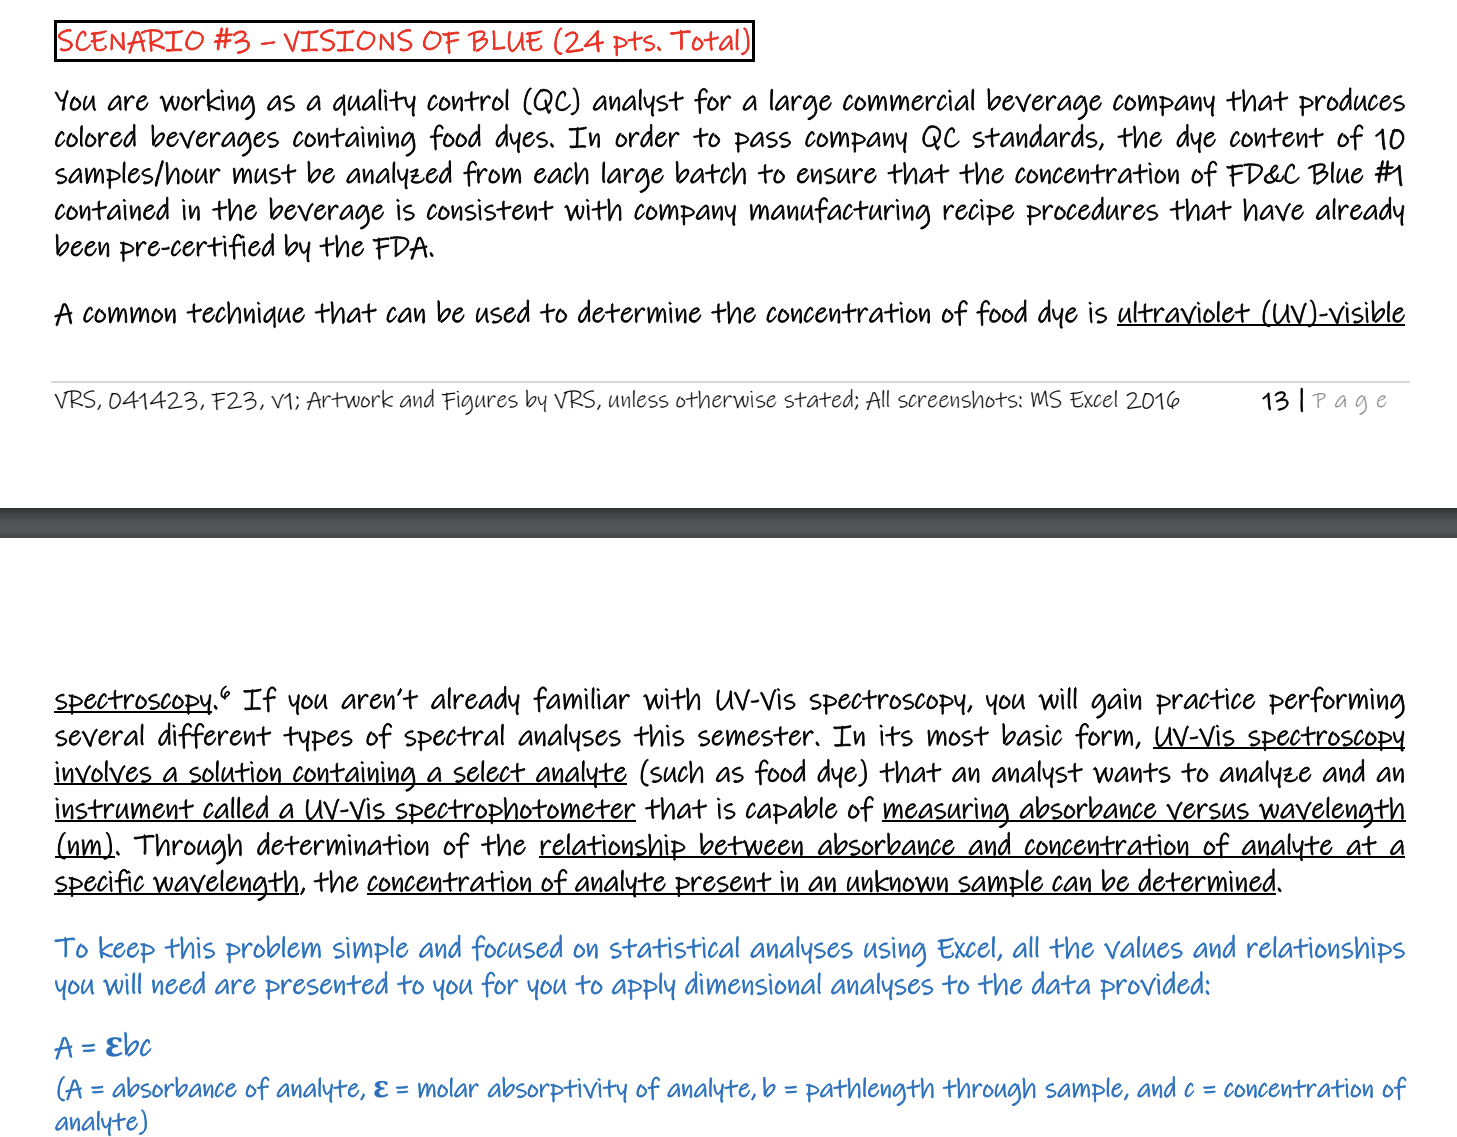
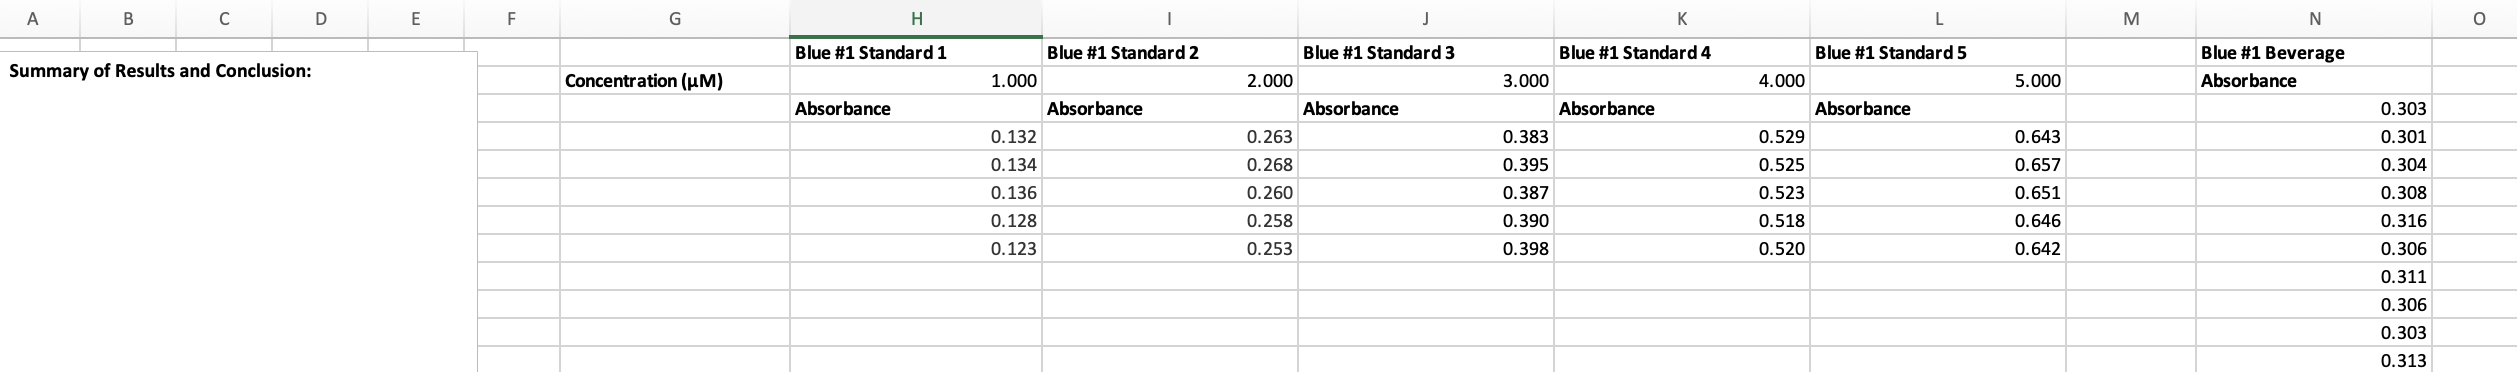
( 3 pts. total; 1 pt. per item) Calculate It #1 - You prepare a series of FD&C Blue #1 standard solutions ( solutions of known concentration) as follows: 1.00 um, 2.00 UM, 3.00 UM, 4.00 um, and 5.00 MM. You obtain 5 measurements of each standard for averaging along with the 10 samples of commercial beverage measured at 630 nm. Calculate the following for the data provided : a) average absorbance of each standard and the commercial beverage b ) standard deviation of the absorbance of each standard and the commercial beverage 0 RSD of the absorbance of each standard and the commercial beverage ( 4 pts. total; 2 pts. for graph, 1 pt. for each item) Graph It #2 - Using the average absorbance values for the FD&C Blue #1 solutions you calculated in "calculate It #1", generate a calibration curve (absorbance Versus concentration) containing the following: a ) appropriate title b) appropriate axes labels ( with units) ( 2 pts. total; 1 pt. per item) Calculate/Graph It #3 - Apply statistical analyses to the calibration curve by adding the following: a) trendline with equation and R2 value ( set to 3 decimal places) b) error bars ( you will need to calculate the 95% confidence interval of the absorbance of each standard; hint: each standard will have different error bar values) (2 pts.) calculate It # 4 - Using the trendline equation of the calibration curve generated in "calculate/ Graph It #3" and the average absorbance of the commercial beverage calculated in " calculate It #1", calculate the concentration of FD&C Blue #1 in the commercial beverage. Note: y = mx + b is equal to A = Ebc, where in this case y = A (unitless), Eb = m (um-1 . cm-1), and c = x (HM) ( 2 pts.) Graph It #5 - Using the "select data source menu", add the average absorbance versus concentration of the commercial beverage to the calibration curve as a second data set and do the following : ensure that this data point is not included in the trendline generated by the calibration standards ensure that this data point is a different color from that of the calibration standards add error bars to this data point ( you will need to calculate the 95% confidence of the absorbance of the commercial beverage )( 5 pts. ) Calculate It #6 - Determine the standard deviation present in the FD&C Blue #1 concentration of the commercial beverage contributed by the calibration standards (Sx) using the following equation along with the LINEST function: Spectral Analysis 1: Investigating Food Dyes in Sports Beverages. https://www.vernier.com/files/sample labs/APCHEM-D1-food dyes.pdf VRS, 041423, F23, V1; Artwork and Figures by VRS, unless otherwise stated; All screenshots: MS Excel 2016 14 / page Sy ( 4 - 4 ) 2 SX = 1 I ml k + + m2 [ ( xi - x ) 2 , where in this case, Sy is the standard deviation in the FD&C Blue #1 absorbance of the commercial beverage determined from LINEST, m is the slope of the calibration curve from LINEST, K is the number of replicate measurements of the commercial beverage, " is the number of calibration standards used to generate the calibration curve, yis the absorbance value of the commercial beverage , yis the average value of the absorbance values of the calibration standards, x, are the concentration values of each calibration standard, and x is the mean value of the concentration values of the calibration standards. use the LINEST function in Excel to determine the values for sy and m. Note: it may be easiest to calculate the overall equation as pieces, having Excel perform individual calculations first , such as E ( X; - X ), in separate cells . Then , the overall equation can be solved in a new cell by selecting and combining the results from the individual cells . To enter this formula , you will need to use the " SQRT" function , "" to designate " to the power of ", the "ABS" function for absolute value, and lots of parentheses to designate order of mathematical operations.( 2 pts. total; 1 pt. per item) Calculate It #7 - Now that you have calculated the standard deviation in the FD&C Blue #1 concentration, calculate the following: a ) 70 RSD b) 95 % confidence interval (+ +sx) , where Sx is the standard deviation of the commercial beverage concentration found in Calculate It #6 and + is a Student's + constant calculated using the TINV function in Excel by entering 0.05 as probability (95% confidence) followed by a comma and the number of degrees of freedom = the number of standards used to generate the calibration curve minus 2 (i.e., 5 standards - 2 = 3). ( 2 pts. total; 1 pt. per item) Report It #8 - In the Summary of Results and Conclusion text box provided, report the concentration of FDEC Blue #1 in the 10 samples tested as follows: a ) Average +1- 90 RSD 6) Range of concentration based on 95% confidence interval (e.g., 10.00 +/- 5.00 Mm or 5.00-15.00 MM) ( 2 pts. ) Conclude It #9 - Concentrations of FD&C Bluett within the range of 2. 30-2.40 UM meet company manufacturing recipe procedures pre-certified by the FDA. In the Summary of Results and Conclusion text box provided , conclude whether or not the concentration of food dye in the samples tested meets this standard? If so, you may state that the batch " passes" inspection. If not, you should state that the batch "fails" inspection.SCENARIO #3 - VISIONS OF BLUE (24 pts. Total) You are working as a quality control ( QC) analyst for a large commercial beverage company that produces colored beverages containing food dyes. In order to pass company QC standards, the dye content of 10 samples/hour must be analyzed from each large batch to ensure that the concentration of FD&C Blue #1 contained in the beverage is consistent with company manufacturing recipe procedures that have already been pre-certified by the FDA. A common technique that can be used to determine the concentration of food dye is ultraviolet (UV )-visible VRS, 041423, F23, V1; Artwork and Figures by VRS, unless otherwise stated; All screenshots: MS Excel 2016 13 / page spectroscopy." If you aren't already familiar with UV-Vis spectroscopy , you will gain practice performing several different types of spectral analyses this semester . In its most basic form, UV-Vis spectroscopy involves a solution containing a select analyte ( such as food dye ) that an analyst wants to analyze and an instrument called a UV-Vis spectrophotometer that is capable of measuring absorbance versus wavelength ( um). Through determination of the relationship between absorbance and concentration of analyte at a specific wavelength, the concentration of analyte present in an unknown sample can be determined. To keep this problem simple and focused on statistical analyses using Excel, all the values and relationships you will need are presented to you for you to apply dimensional analyses to the data provided: A = Ebc ( A = absorbance of analyte, E = molar absorptivity of analyte, b = pathlength through sample, and c = concentration of analyte )A B C D E F G H K L M N Blue #1 Standard 1 Summary of Results and Conclusion: Blue #1 Standard 2 Blue #1 Standard 3 Blue #1 Standard 4 Blue #1 Standard 5 Blue #1 Beverage Concentration (HM) 1.000 2.000 3.000 4.00 5.000 Absorbance Absorbance Absorbance Absorbance Absorbance Absorbance 0.303 0.132 0.263 0.383 0.529 0.643 0.301 0.134 0.268 .395 0.525 0.657 0.304 0.136 0.260 0.387 0.523 0.651 0.308 0.128 0.258 0.390 0.518 0.646 0.316 0.123 0.253 0.398 0.520 0.642 0.306 0.311 0.306 0.303 0.313
Step by Step Solution
There are 3 Steps involved in it
1 Expert Approved Answer
Step: 1 Unlock
Question Has Been Solved by an Expert!
Get step-by-step solutions from verified subject matter experts
Step: 2 Unlock
Step: 3 Unlock
Students Have Also Explored These Related Mathematics Questions!