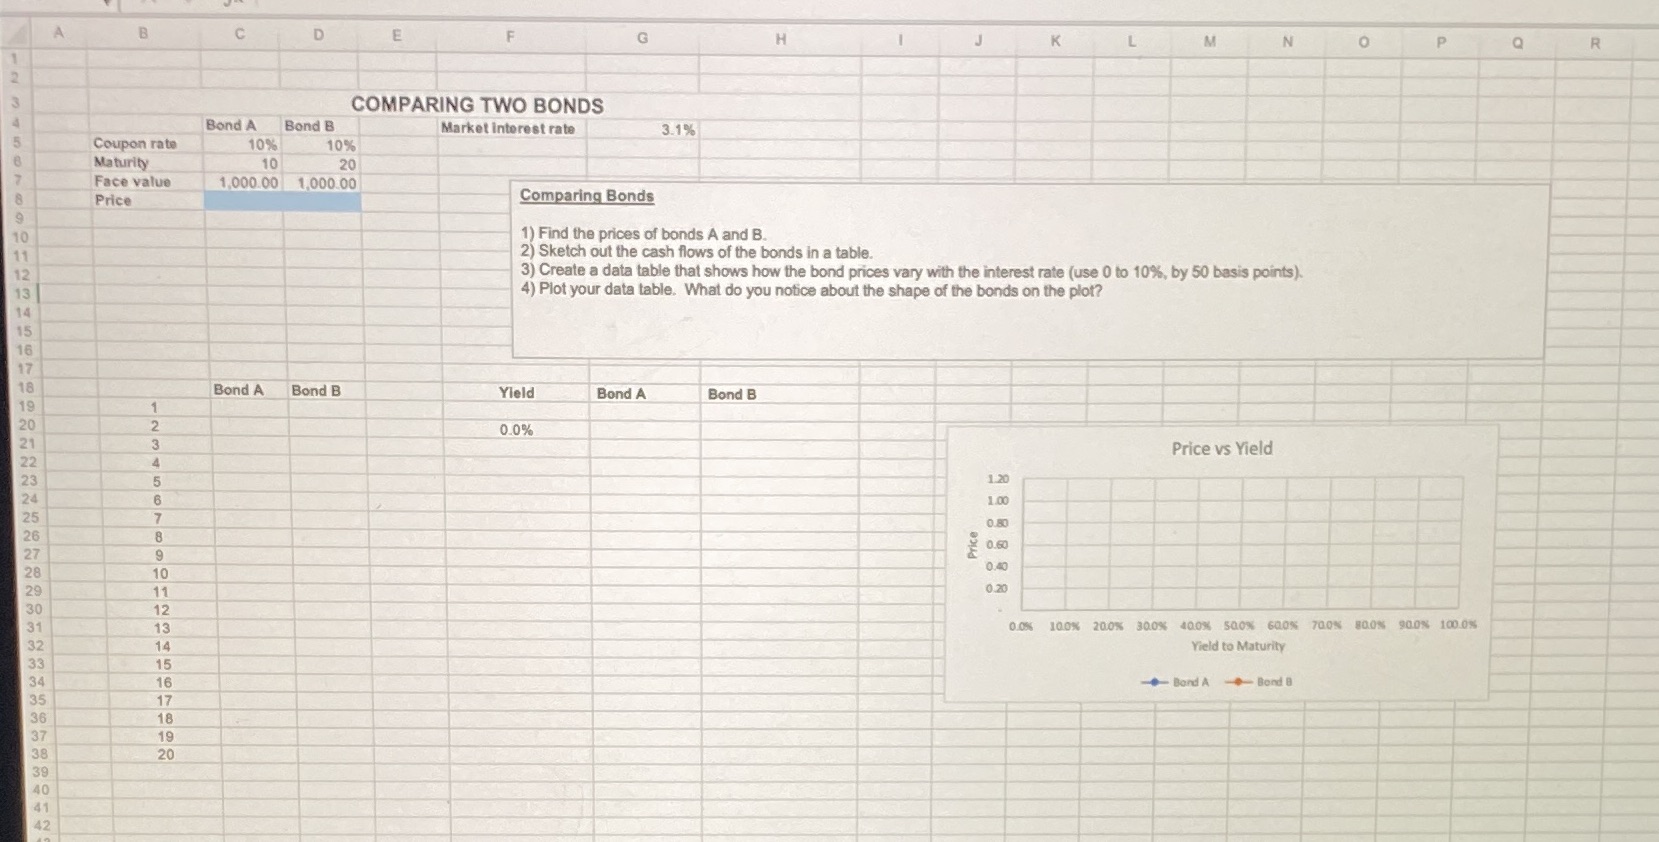
Question: Please use the same format shown here. Also show the excel formulas. P Q A B C D E F G H K L M

Please use the same format shown here. Also show the excel formulas.

Please use the same format shown here. Also show
P Q A B C D E F G H K L M N O R COMPARING TWO BONDS Bond A Bond B Market interest rate 3.1% Coupon rate 10% 10%% Maturity 10 20 Face value 1,000.00 1,000.00 Comparing Bonds Price 1) Find the prices of bonds A and B. 2) Sketch out the cash flows of the bonds in a table. 3) Create a data table that shows how the bond prices vary with the interest rate (use 0 to 10%, by 50 basis points). 4) Plot your data table. What do you notice about the shape of the bonds on the plot? 13 14 18 Bond A Bond B Yield Bond A Bond B 19 20 0.0% Price vs Yield 1.20 24 1.00 25 0.80 26 Price 0.60 U D WN T OOOVO CI A W N 27 0:40 28 0.20 29 30 0.0% 100% 200% 300% 400% SQ0% 600% 700% BOON 900% 100.0% 31 Yield to Maturity 32 33 Bond A - Bond B 34 16 35 17 36 18 37 19 38 20 39 40 41 42

Step by Step Solution

There are 3 Steps involved in it

1 Expert Approved Answer
Step: 1 Unlock blur-text-image
Question Has Been Solved by an Expert!

Get step-by-step solutions from verified subject matter experts

Step: 2 Unlock
Step: 3 Unlock

Students Have Also Explored These Related Finance Questions!