

Question: PLEASE USE THE SAMPLES AND DATA GIVEN IN THE QUESTION ONLY....PLEASE USE THE SAMPLES AND DATA GIVEN IN THE QUESTION ONLY, DONT USE FROM ANY
PLEASE USE THE SAMPLES AND DATA GIVEN IN THE QUESTION ONLY....PLEASE USE THE SAMPLES AND DATA GIVEN IN THE QUESTION ONLY, DONT USE FROM ANY OTHER AND AVAILABLE ANSWERS.
PLEASE USE THE SAMPLES AND DATA GIVEN IN THE QUESTION ONLY, DONT USE FROM ANY OTHER AND AVAILABLE ANSWERS.
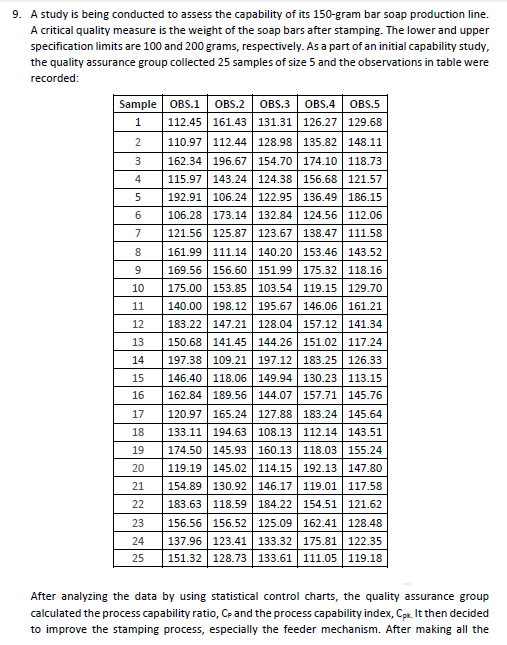
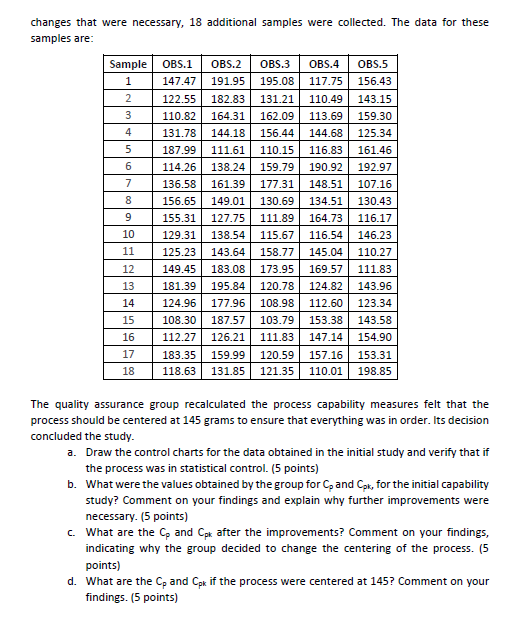
9. A study is being conducted to assess the capability of its 150-gram bar soap production line. A critical quality measure is the weight of the soap bars after stamping. The lower and upper specification limits are 100 and 200 grams, respectively. As a part of an initial capability study, the quality assurance group collected 25 samples of size 5 and the observations in table were recorded: Sample OBS.1 OBS.2 OBS.3 OBS.4 OBS.5 112.45 161.43 131.31 126.27 129.68 1 2 3 4 5 6 7 8 9 10 11 12 13 110.97 112.44 | 128.98 135.82 148.11 162.34 196.67 154.70 174.10118.73 115.97 143.24 124.38 156.68 121.57 192.91 106.24 122.95 136.49 186.15 106.28 173.14 132.84 124.56 112.06 121.56 125.87 123.67 138.47 111.58 161.99 111.14 140.20 153.46 143.52 169.56 156.60 151.99 175.32 118.16 175.00 153.85 103.54 119.15 129.70 140.00 198.12 195.67 146.06 161.21 183.22 147.21 128.04 157.12 141.34 150.68 141.45 144.26 151.02 117.24 197.38 109.21 197.12 183.25 126.33 146.40 118.06 149.94 130.23 113.15 162.84 189.56 144.07 157.71 145.76 120.97 165.24 127.88 183.24 145.64 133.11 194.63 108.13 112.14 143.51 174.50 145.93 160.13 118.03 155.24 119.19 145.02 114.15 192.13 147.80 154.89 130.92 146.17 119.01 117.58 183.63 118.59 184.22 154.51 121.62 156.56 156.52 125.09 162.41 | 128.48 137.96 123.41 133.32175.81 122.35 151.32 128.73 133.61 111.05 119.18 14 15 16 17 18 19 20 21 22 23 24 25 After analyzing the data by using statistical control charts, the quality assurance group calculated the process capability ratio, C and the process capability index, Cpt. It then decided to improve the stamping process, especially the feeder mechanism. After making all the changes that were necessary, 18 additional samples were collected. The data for these samples are: Sample OBS.1 OBS.2 OBS.3 OBS.4 OBS.5 1 147.47 191.95 195.08 117.75 156.43 2 122.55 182.83 131.21 110.49 143.15 3 110.82 164.31 162.09 113.69 159.30 4 131.78 144.18 156.44 144.68 125.34 5 187.99 111.61 110.15 116.83 161.46 6 114.26 138.24 159.79 190.92 192.97 7 136.58 161.39 177.31 148.51 107.16 8 156.65 149.01 130.69 134.51 130.43 9 155.31 127.75 111.89 164.73 116.17 10 129.31 138.54 115.67 116.54 146.23 11 125.23 143.64 158.77 145.04 110.27 12 149.45 183.08 173.95 169.57 111.83 13 181.39 195.84 120.78 124.82 143.96 14 124.96 177.96 108.98 112.60 123.34 15 108.30 187.57 103.79 153.38 143.58 16 112.27 126.21 111.83 147.14 154.90 17 183.35 159.99 120.59 157.16 153.31 18 118.63 131.85 121.35 110.01 198.85 The quality assurance group recalculated the process capability measures felt that the process should be centered at 145 grams to ensure that everything was in order. Its decision concluded the study. a. Draw the control charts for the data obtained in the initial study and verify that if the process was in statistical control. (5 points) b. What were the values obtained by the group for Cand Cok, for the initial capability study? Comment on your findings and explain why further improvements were necessary. (5 points) c. What are the Cp and Cpx after the improvements? Comment on your findings, indicating why the group decided to change the centering of the process. (5 points) d. What are the Cp and Cpk if the process were centered at 145? Comment on your findings. (5 points)Step by Step Solution
There are 3 Steps involved in it
1 Expert Approved Answer
Step: 1 Unlock

Question Has Been Solved by an Expert!
Get step-by-step solutions from verified subject matter experts
Step: 2 Unlock
Step: 3 Unlock