

Question: Please use the set up the graphs the same as the question if possible. Thanks! 2. Tax Revenue and 1. Equilibrium Effect Deadweight Loss STEP:
Please use the set up the graphs the same as the question if possible. Thanks!
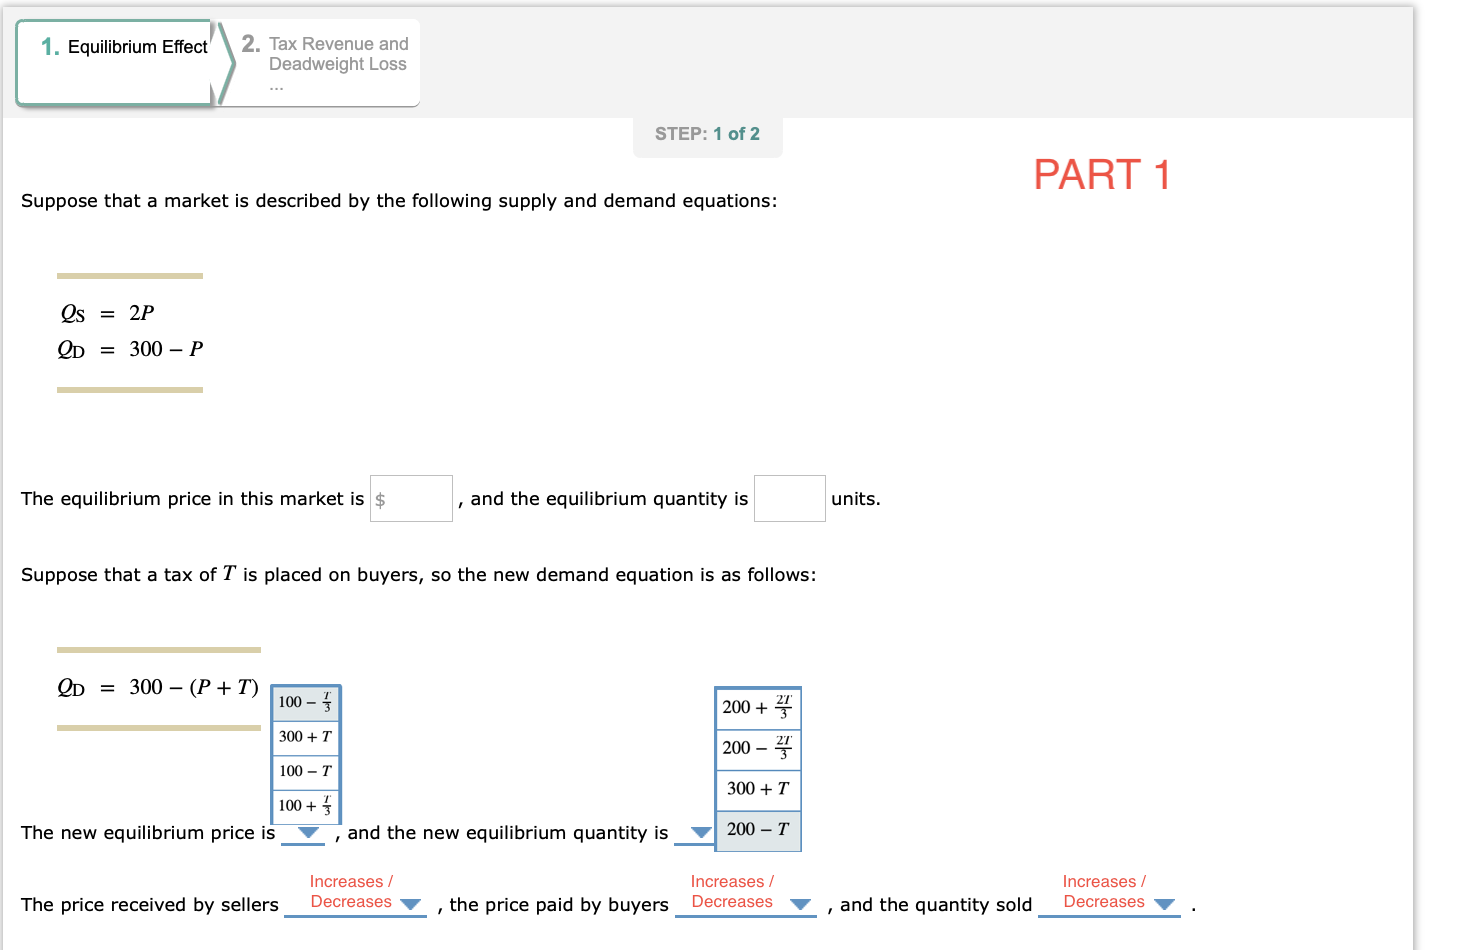
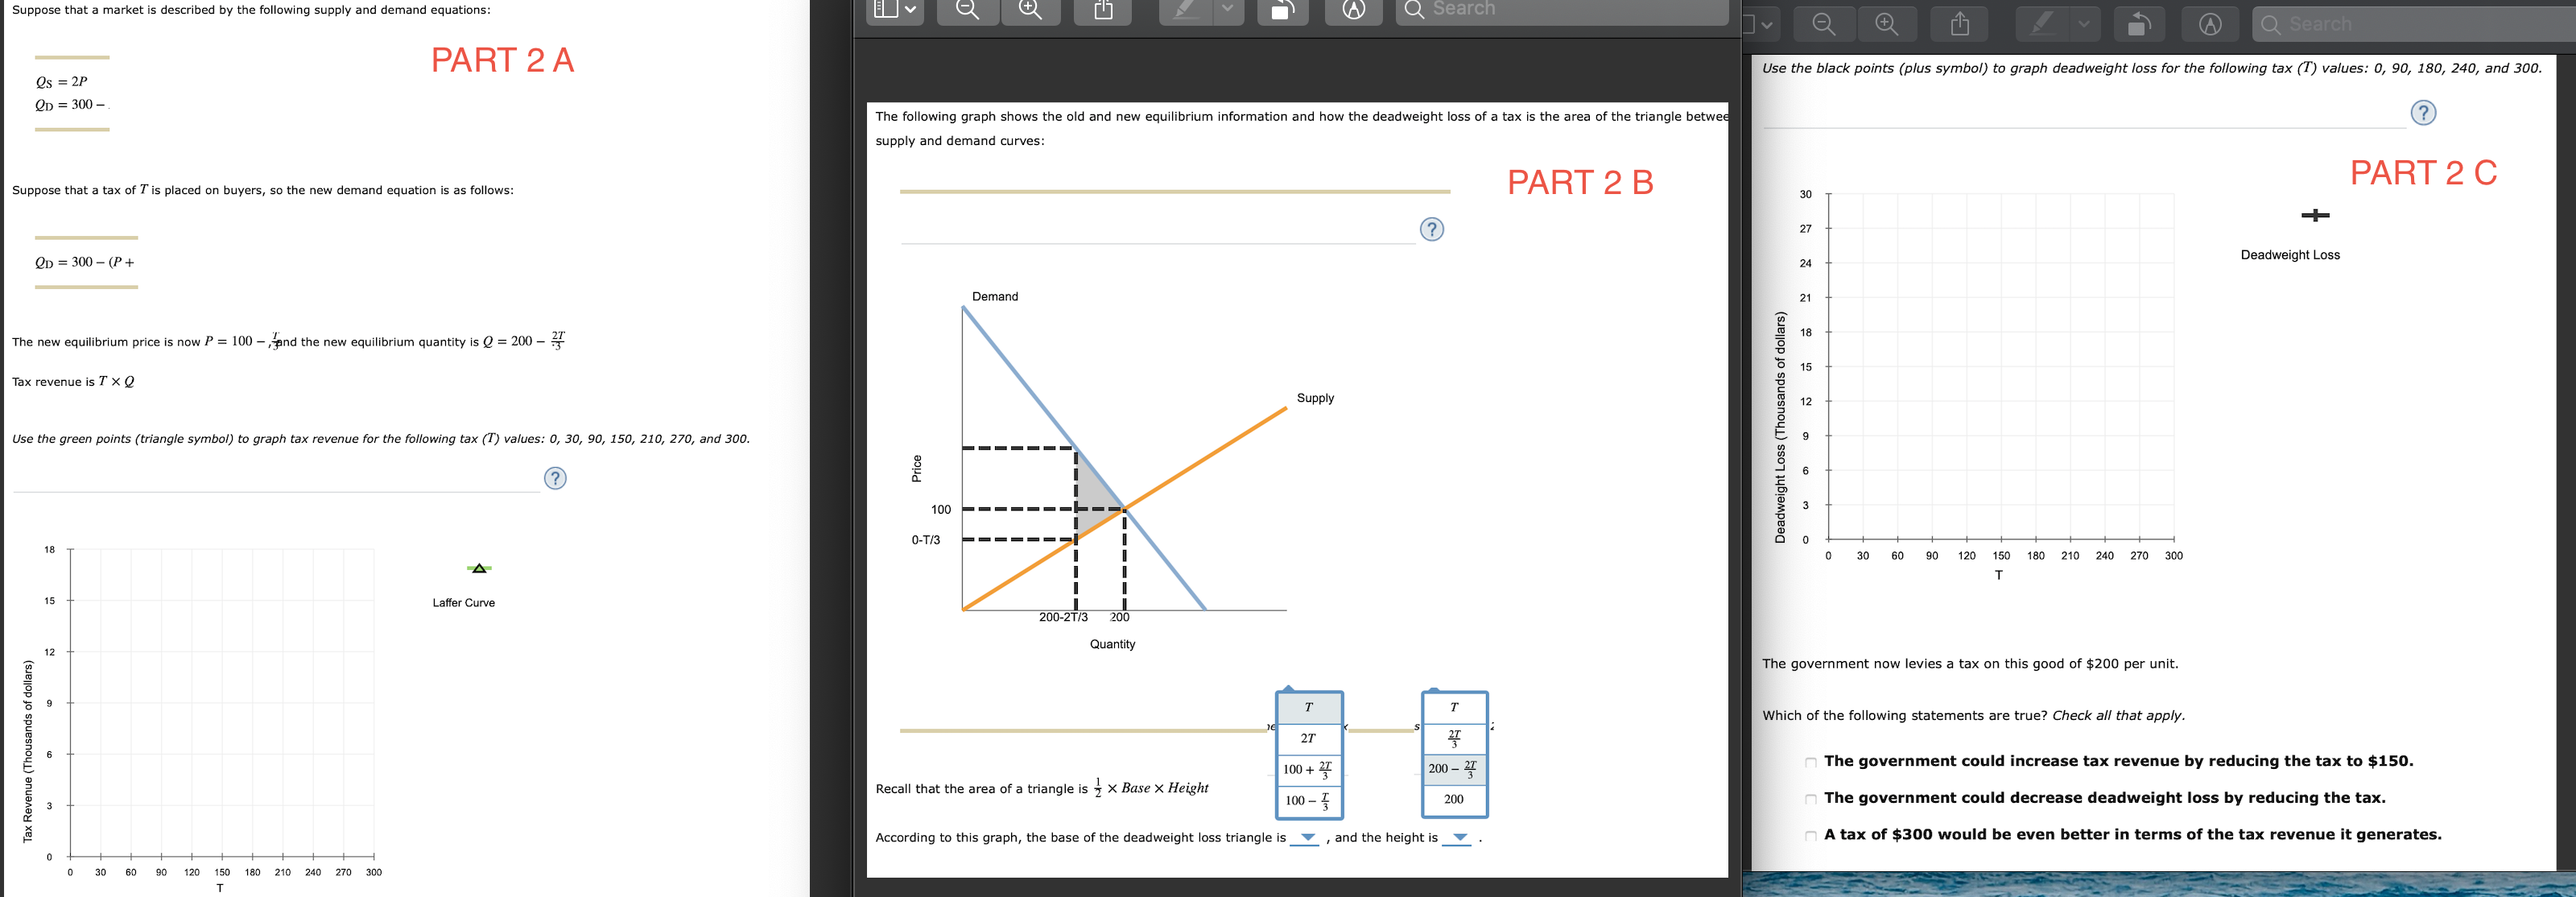
2. Tax Revenue and 1. Equilibrium Effect Deadweight Loss STEP: 1 of2 PART 1 Suppose that a market is described by the following supply and demand equations: (25 = 2P QD = 300 P The equilibrium price in this market is $ , and the equilibrium quantity is units. Suppose that a tax of T is placed on buyers, so the new demand equation is as follows: QD = 3UD(P+T) The new equilibrium price is V , and the new equilibrium quantity is V Increases.r Increases! Increases.l The price received by sellers Decreases V , the price paid by buyers Decreases V , and the quantity sold Decreases V . Suppose that a market is described by the following supply and demand equations: Search Q Se Qs = 2P PART 2 A Use the black points (plus symbol) to graph deadweight loss for the following tax (T) values: 0, 90, 180, 240, and 300. QD = 300 - The following graph shows the old and new equilibrium information and how the deadweight loss of a tax is the area of the triangle betwee (? supply and demand curves: Suppose that a tax of T is placed on buyers, so the new demand equation is as follows: PART 2 B NNN8 PART 2 C ? + QD = 300 - (P + Deadweight Loss Demand The new equilibrium price is now P = 100 - , and the new equilibrium quantity is @ = 200 - ? Tax revenue is T x Q Supply Use the green points (triangle symbol) to graph tax revenue for the following tax (T) values: 0, 30, 90, 150, 210, 270, and 300. Price ON ? 100------ 18 O-T/3 Deadweight Loss (Thousands of dollars) ow . 30 60 90 120 150 180 210 240 270 300 Laffer Curve 200-2T/3 Quantity Tax Revenue (Thousands of dollars) The government now levies a tax on this good of $200 per unit. T T 27 27 Which of the following statements are true? Check all that apply. 200 - 27 The government could increase tax revenue by reducing the tax to $150. w Recall that the area of a triangle is 2 X Base X Height 100 + 27 100 - I 200 n The government could decrease deadweight loss by reducing the tax. According to this graph, the base of the deadweight loss triangle is , and the height is A tax of $300 would be even better in terms of the tax revenue it generates. 30 60 90 120 150 180 210 240 270 300
Step by Step Solution
There are 3 Steps involved in it

Get step-by-step solutions from verified subject matter experts