

Question: Please use the stock infomation from Apple & Microsoft to fill in the excel sheet: Apple Info Microsoft Info Revenue Earnings Per Share FY 2019
Please use the stock infomation from Apple & Microsoft to fill in the excel sheet:
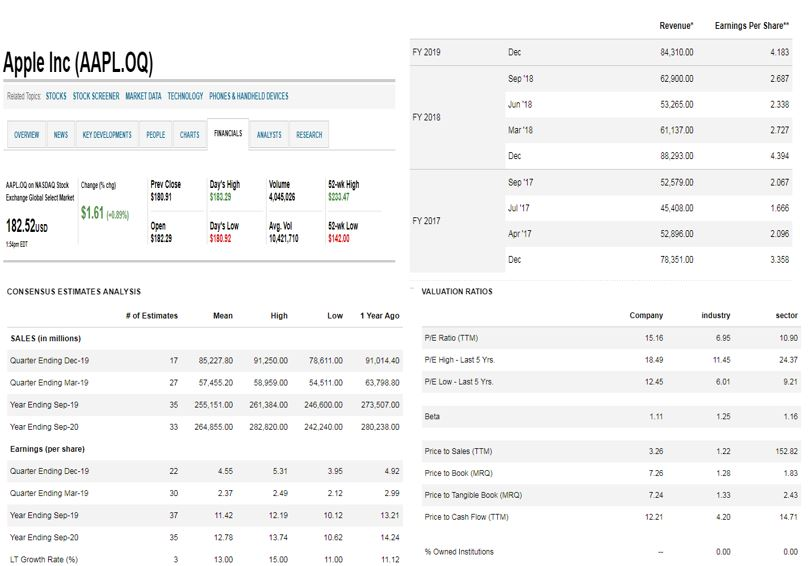
Apple Info
Microsoft Info
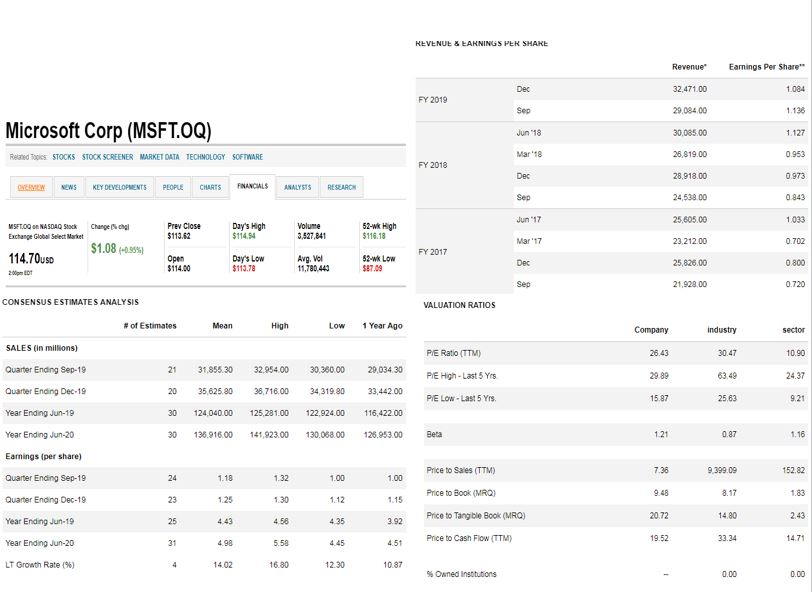
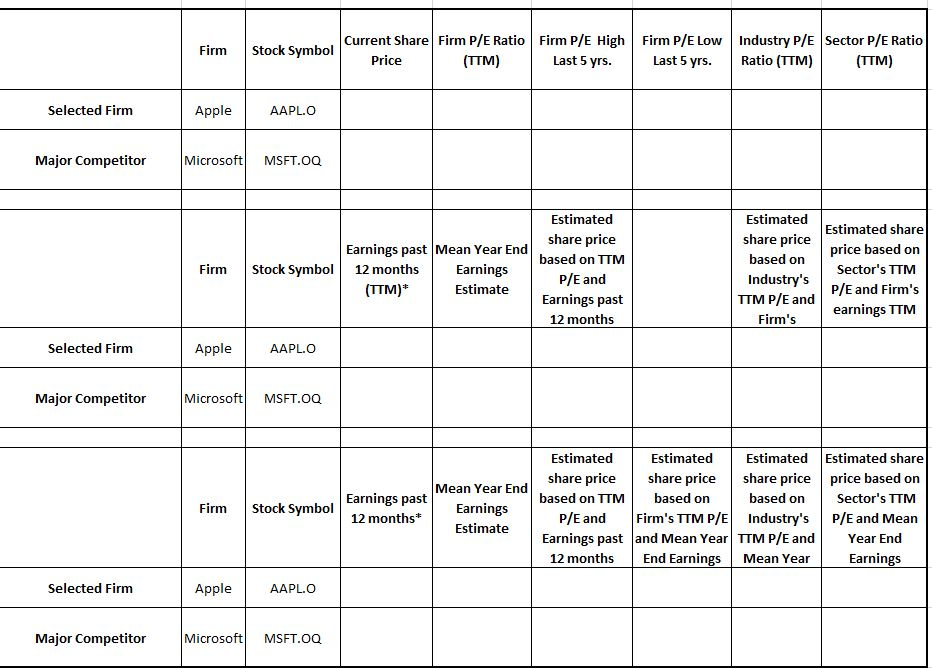
Revenue Earnings Per Share FY 2019 84 310 00 4.183 2687 2 338 2.727 4.394 2 067 1.686 2096 3.358 Apple Inc (AAPL.O0) Sep 18 un 18 Mar 18 62,900.00 Related Topics STOCKS STOCK SCREENER MARKET DATA TECHNOLOGY PHONES&HANDHELD DEVICE 53.26500 61,137.00 88,293.00 52,579.00 45 408.00 528600 78,351.00 FY 2018 OVERIEW NEWS KEY DEVELOPMENTS PEOPLE CHARTS FINANCIALS ANAYISTS RESEARCH Sep 17 u'17 Apr 17 PeClose Day's High Volume $1301 52-wk High xchage Global Select Market 183.29 $1.61489%) FY 2017 82.52uso Days Low A Vo 180.92 52-wk Low 18229 0,421,710$14200 CONSENSUS ESTIMATES ANALYSIS VALUATION RATIOS # of Estimates Low Year Ago SALES (in millions) Quarter Ending Dec-19 Quarter Ending Mar-19 Year Ending Sep-19 Year Ending Sep-20 Earnings (per share Quarter Ending Dec-19 Quarer Ending Mar-19 Year Ending Sep-19 Year Ending Sep-20 LT Growth, Rate (%) PIE Rato (TTM PIE High-Last 5 Yrs PIE Low-Last 5 Yr. 15.16 18.49 1245 6.95 10.90 24.37 9.2 ,014 40 11.45 17 85.227.80 91.250 00 78,611.00 91 27 57,455.20 58,959.00 54.511 00 35 255,151.00 261,384.00 246.600.00 273.50700 33 264,855.00 282,820.00 242.24000 280238.00 63,79880 1.25 Price to Sales (TTM) 3.26 7 26 7 24 12 21 1.22 152.82 5.31 2.49 12.19 13.74 15.00 3.95 212 10.12 10.82 1.00 Price to Bock (MRO 1.28 1.83 299 Price to Tangible Book (MRQ) 13.21 14 24 1.12 30 1.33 11.42 12.78 13.00 Price to Cash Flow (TTM 14.71 35 % Owned Institutions 0.00 0.00 Revenue" Earnings Per Share 32,471.00 29,084.00 30.085.00 1.084 FY 2019 Sep Jun 18 Mar '18 Microsoft Corp (MSFT.0Q) 1.127 0.953 0.973 0843 1.033 0.702 0.800 0.720 26,819.00 aed Tpcs STOCKS STOCK SCREENER MARKET DATA TECHNOLOGY SOFTWARE FY 2018 28,918.00 24,538.00 25,605.00 geweyy NEWS KEY DEVELOPMENTS PEOPLE CHARTS fNANCALS ANALYSTS RE ARCH Sep Jun 17 Mar '17 SFT0ONASDAQ Sock Changeg Exchange Global Select Market Prev Close $113.62 Day's High $11454 52-wk High $116.18 527,841 23,212.00 25,826.00 21,928.00 $1.08 (055%) FY 2017 114.70usD Open $114.00 Day's Low $113.78 52-wk Low $87.09 11,780,444 00pm CONSENSUSESTIMATES ANALYSIS VALUATION RATIOS # of Estimates Mean High Low 1 Year Ago SALES (in milions) Quarter Ending Sep-19 Quarter Ending Dec-19 Year Ending Jun-19 Year Ending Jun-20 Earnings (per share) Quarter Ending Sep-19 Quarter Ending Dec-19 Year Ending Jun-19 Year Ending Jun-20 LT Growth Rate (96) 26.43 29.89 15.87 30.47 63.48 25.63 0.90 21 31,855.30 32.954.00 30,360.00 20 35,625.80 38,716.00 34,31980 30 124,040.00 125,281.00 122.924.00 116,422.00 30 35.91600 141,923.00 130.068.00 126.953.00 PIE Ratio (TTM PIE High-Last 5 Yrs PIE LOW-Last 5 Yrs 29,034.30 24.37 33,442.00 Beta Price to Saies (TTM) Price to Book (MRC) Price to Tangble Book (MRO) Prce to Cash Flow (TTM) 399.09 52.82 9.48 20.72 19.52 23 125 14.80 25 3.92 45t 10.87 33.34 14.71 31 4.98 4.45 14.02 16.80 12.30 % owned institutions Current Share Firm P/E Ratio Firm P/E High Firm P/E Low Industry P/E Sector P/E Ratio Firm Stock Symbol Price TTM) Last 5 yrs. Last 5 yrs. Ratio (TTM) (TTM) Selected Firm Apple AAPL.O Major Competitor MicrosoftMSFT.OO Estimated share price based on TTM P/E and Earnings past 12 months Estimated share price based orn Industry's TTM P/E and Firm's Estimated share price based on Sector's TTM P/E and Firm's earnings TTM Earnings past Mean Year End Firm Stock Symbo 12 months Earnings Estimate Selected Firm Apple AAPL.O Major Competitor MicrosoftMSFT.oo Estimated share price based on | Estimated share price share priceprice based on based on Estimated Estimated share Mean Year End Earnings past 12 months based on Sector's TTM P/E and Firm's TTM P/E Industry'sP/E and Mean Firm Stock Symbol Earnings Estimate Earnings pas t and Mean Year TTM P/E and Year End Earnings 12 months End Earnings Mean Yean Selected Firm Apple AAPL.O Major Competitor MicrosoftMSFT.oo Revenue Earnings Per Share FY 2019 84 310 00 4.183 2687 2 338 2.727 4.394 2 067 1.686 2096 3.358 Apple Inc (AAPL.O0) Sep 18 un 18 Mar 18 62,900.00 Related Topics STOCKS STOCK SCREENER MARKET DATA TECHNOLOGY PHONES&HANDHELD DEVICE 53.26500 61,137.00 88,293.00 52,579.00 45 408.00 528600 78,351.00 FY 2018 OVERIEW NEWS KEY DEVELOPMENTS PEOPLE CHARTS FINANCIALS ANAYISTS RESEARCH Sep 17 u'17 Apr 17 PeClose Day's High Volume $1301 52-wk High xchage Global Select Market 183.29 $1.61489%) FY 2017 82.52uso Days Low A Vo 180.92 52-wk Low 18229 0,421,710$14200 CONSENSUS ESTIMATES ANALYSIS VALUATION RATIOS # of Estimates Low Year Ago SALES (in millions) Quarter Ending Dec-19 Quarter Ending Mar-19 Year Ending Sep-19 Year Ending Sep-20 Earnings (per share Quarter Ending Dec-19 Quarer Ending Mar-19 Year Ending Sep-19 Year Ending Sep-20 LT Growth, Rate (%) PIE Rato (TTM PIE High-Last 5 Yrs PIE Low-Last 5 Yr. 15.16 18.49 1245 6.95 10.90 24.37 9.2 ,014 40 11.45 17 85.227.80 91.250 00 78,611.00 91 27 57,455.20 58,959.00 54.511 00 35 255,151.00 261,384.00 246.600.00 273.50700 33 264,855.00 282,820.00 242.24000 280238.00 63,79880 1.25 Price to Sales (TTM) 3.26 7 26 7 24 12 21 1.22 152.82 5.31 2.49 12.19 13.74 15.00 3.95 212 10.12 10.82 1.00 Price to Bock (MRO 1.28 1.83 299 Price to Tangible Book (MRQ) 13.21 14 24 1.12 30 1.33 11.42 12.78 13.00 Price to Cash Flow (TTM 14.71 35 % Owned Institutions 0.00 0.00 Revenue" Earnings Per Share 32,471.00 29,084.00 30.085.00 1.084 FY 2019 Sep Jun 18 Mar '18 Microsoft Corp (MSFT.0Q) 1.127 0.953 0.973 0843 1.033 0.702 0.800 0.720 26,819.00 aed Tpcs STOCKS STOCK SCREENER MARKET DATA TECHNOLOGY SOFTWARE FY 2018 28,918.00 24,538.00 25,605.00 geweyy NEWS KEY DEVELOPMENTS PEOPLE CHARTS fNANCALS ANALYSTS RE ARCH Sep Jun 17 Mar '17 SFT0ONASDAQ Sock Changeg Exchange Global Select Market Prev Close $113.62 Day's High $11454 52-wk High $116.18 527,841 23,212.00 25,826.00 21,928.00 $1.08 (055%) FY 2017 114.70usD Open $114.00 Day's Low $113.78 52-wk Low $87.09 11,780,444 00pm CONSENSUSESTIMATES ANALYSIS VALUATION RATIOS # of Estimates Mean High Low 1 Year Ago SALES (in milions) Quarter Ending Sep-19 Quarter Ending Dec-19 Year Ending Jun-19 Year Ending Jun-20 Earnings (per share) Quarter Ending Sep-19 Quarter Ending Dec-19 Year Ending Jun-19 Year Ending Jun-20 LT Growth Rate (96) 26.43 29.89 15.87 30.47 63.48 25.63 0.90 21 31,855.30 32.954.00 30,360.00 20 35,625.80 38,716.00 34,31980 30 124,040.00 125,281.00 122.924.00 116,422.00 30 35.91600 141,923.00 130.068.00 126.953.00 PIE Ratio (TTM PIE High-Last 5 Yrs PIE LOW-Last 5 Yrs 29,034.30 24.37 33,442.00 Beta Price to Saies (TTM) Price to Book (MRC) Price to Tangble Book (MRO) Prce to Cash Flow (TTM) 399.09 52.82 9.48 20.72 19.52 23 125 14.80 25 3.92 45t 10.87 33.34 14.71 31 4.98 4.45 14.02 16.80 12.30 % owned institutions Current Share Firm P/E Ratio Firm P/E High Firm P/E Low Industry P/E Sector P/E Ratio Firm Stock Symbol Price TTM) Last 5 yrs. Last 5 yrs. Ratio (TTM) (TTM) Selected Firm Apple AAPL.O Major Competitor MicrosoftMSFT.OO Estimated share price based on TTM P/E and Earnings past 12 months Estimated share price based orn Industry's TTM P/E and Firm's Estimated share price based on Sector's TTM P/E and Firm's earnings TTM Earnings past Mean Year End Firm Stock Symbo 12 months Earnings Estimate Selected Firm Apple AAPL.O Major Competitor MicrosoftMSFT.oo Estimated share price based on | Estimated share price share priceprice based on based on Estimated Estimated share Mean Year End Earnings past 12 months based on Sector's TTM P/E and Firm's TTM P/E Industry'sP/E and Mean Firm Stock Symbol Earnings Estimate Earnings pas t and Mean Year TTM P/E and Year End Earnings 12 months End Earnings Mean Yean Selected Firm Apple AAPL.O Major Competitor MicrosoftMSFT.oo
Step by Step Solution
There are 3 Steps involved in it

Get step-by-step solutions from verified subject matter experts